
Multimodal Prominence Marking in YouTube Monologs - The Interaction of Intonation and Eyebrow Movements
Published by Reblogs - Credits in Posts,
1. Introduction
In this work, we analyze the co-occurrence of eyebrow movements and pitch accents of differing prominence levels, as well as the height of the pitch accents produced by a sample of English-speaking YouTubers. YouTubers—like others speaking in a public setting—rely on a combination of audio-visual cues in order to keep their audience engaged. Audience engagement is crucial since making videos on YouTube is not only entertainment, but also the YouTubers' business. Over the years, a very specific speaking style has been identified by newspapers and popular media, especially in YouTube videos where the YouTuber is talking directly to the camera in a monolog without props and in a semi-spontaneous, unscripted, but not completely unprepared style. It has been described as being "bouncy", a specific voice used for "talking to the audience"—some even call it "intellectual used-car-salesman voice" (Beck, 2015, no page numbers). These comments suggest that this particular speaking style is also quite controversial—it can be perceived as annoying by many listeners/viewers (Jennings, 2021). This style of speech on YouTube has been dubbed "YouTube Voice". The label was first applied by Beck (2015), and then re-used by several other (online) news and lifestyle outlets (e.g., Green, 2015; Hagi, 2017; Jennings, 2021).
YouTube Voice is mainly characterized by a variety of emphasis strategies such as long and hyper-articulated vowels and consonants that YouTubers are "over-enunciating compared to casual speech which is something newscasters or radio personalities do" (Hagi, 2017, no page numbers; see also Beck, 2015). These hyper-articulated vowels and consonants are additionally used to create a certain rhythm that adds more interest to what the YouTuber is saying: regardless of the content, adding the rhythm and the "different kind of intonation makes it more engaging to listen to" and is meant "to show excitement and enthusiasm" (Hagi, 2017, no page numbers). Attracting and especially maintaining the attention of a viewer takes (vocal) effort, even when the viewer has clicked on the video of their own accord (Beck, 2015).
These emphasis strategies are of course not used exclusively on YouTube, but are standard strategies used for emphasis in everyday life. Emphatic accents like lengthened vowels (also termed positive intensification), lengthened onset consonants (reinforcement accents) or a number of these accents in a row creating a very noticeable rhythm (accent chains) appear everywhere for focus and to highlight important sections of an utterance (Kohler and Niebuhr, 2007; Niebuhr, 2010; Niebuhr et al., 2016; Berger et al., 2020). Studies have shown, for example, that the frequent use of emphatic accents like the ones mentioned above have a positive effect on a speaker's perceived vocal charisma, especially when the types are varied throughout (Niebuhr et al., 2016, 2020; Berger et al., 2020).
It is not only segmental emphatic accents that contribute to the perception of prominence. Pitch accents are local pitch maxima and minima that highlight words or syllables that are—mostly—of great importance for the information structure of an utterance. These pitch maxima and minima are associated with a syllable that is perceived as particularly prominent by listeners (Ladd, 2008; Sridhar et al., 2008). Additionally, the words or syllables that receive a pitch accent cannot always be predicted (Bolinger, 1972; Sridhar et al., 2008); their unpredictability can serve to draw more attention to a pitch-accented portion of an utterance. However, research likewise suggests that if a listener can entrain to the intonation contour a speaker uses before a prominent syllable, they "can predict where focus will occur in the utterance and get a head-start in navigating the discourse structure earlier on" (Ip and Cutler, 2021 p. 21, on Mandarin Chinese; see also Akker and Cutler, 2003, for similar results on English and Dutch). In their study, the accuracy of hearing a target phoneme correctly was higher in "accented contexts (10 misses)" than "in unaccented contexts (24 misses)" (Ip and Cutler, 2021, p. 15), suggesting that prediction accuracy is not 100%. In general—when nothing else changes in the contour—the higher a pitch accent is produced, the more prominent it is perceived (Gussenhoven, 2002). At the same time, pitch height goes in hand with pitch excursion.
The position of the pitch peak relative to the prominent syllable is also important, and, in some instances, can increase or even substitute the effect of pitch height on perceived prominence (Gussenhoven, 2002). If a pitch peak is higher, it tends to take the speaker longer to get to that higher point. It follows that higher peaks also tend to occur later in a prominent syllable than lower peaks. The longer rise takes more effort from the speaker which in turn causes late peaks to be perceived as more prominent than peaks that come early in or even before the prominent syllable (Gussenhoven, 2002). Because of the heightened production effort, "both higher and later peaks elicit more ‘unusual occurrence' interpretations than ‘everyday occurrence' interpretations" (Gussenhoven, 2002, p. 6). Additionally, pitch peaks marking new information in British English also tend to be produced later than other peaks, especially when it is the first pitch accent of an intonation phrase (Wichmann et al., 1997; Gussenhoven, 2002; Zellers et al., 2009). A recent study including the speakers of the present investigation found that the YouTubers in the sample indeed use significantly more late peaks than early peaks (pitch accents aligned with the prominent syllable being the most frequent peak placement), and likewise that emphatic (extra-strong) pitch accents were produced with higher pitch than accents with weak and strong prominences (Berger and Zellers, 2021). This terminology follows DIMA (Deutsche Intonation: Modellierung und Annotation, Kügler et al., 2019), see Section 3.2 for an overview of the annotation system.
Intensity has also been identified as a perceptual cue for prominence (e.g., Vainio and Järvikivi, 2006; Mo, 2008). The videos in this sample have different microphone set-ups and room acoustics, and would therefore not be comparable. Thus, the role of intensity in prominence is not discussed in detail here.
YouTube has the advantage of not only featuring the voice of the speaker, but also his or her gestures and facial expressions. We investigate eyebrow movements as facial expressions since they are always on screen in our data, and hand gestures frequently were moved outside the video frame. Eyebrow movements can be understood as co-called beat gestures that "do not necessarily convey any semantic content but are rather used to signal prominence, to construct rhythmical structures and to highlight words or expressions" (Ambrazaitis and House, 2017, p. 100; cf. McNeill, 2008; Loehr, 2012, for more details on beat gestures). There is much research that suggests a close (temporal) alignment of eyebrow movements and pitch accents, which is why eyebrow movements have often been seen as contributing to prominence, both in terms of the production as well as the perception of a speaker's prosody (e.g., Beskow et al., 2006; Flecha-Garćıa, 2010; Ambrazaitis and House, 2017).
Many studies have reported on the temporal alignment of eyebrow movements and pitch accents. One study found that in British face-to-face dialogues, the "start of the brow raise preceded very closely the start of the accented syllable" by about 60 ms, and that eyebrow raising was more frequent "when giving instructions than when asking a question or acknowledging the receipt of information" (Flecha-Garćıa, 2010, p. 551). That would suggest that eyebrows are used more when asking others to follow or engage. If that is the case, it is reasonable to assume that eyebrow movements are also frequent on YouTube where the YouTuber asks the viewer to follow, continue watching, etc. Furthermore, Flecha-Garćıa (2010) also says eyebrow raises and prominence may be connected, perhaps as an extra level of prominence for especially important words or passages in addition to pitch accents. A study by Swerts and Krahmer (2010) further suggests that "the majority of the ‘no accent' and ‘weak accent' cases [in their data] occur without an accompanying eyebrow movement (76.8 and 62.8%, respectively), the strong accents more often co-occur with eyebrow movements (70.1%) than not. However, conversely, the mere presence of an eyebrow movement does not imply the presence of a strong accent, given that only a minority of the eyebrow movements (47 out of 303) occurs with a strong accent" (Swerts and Krahmer, 2010, p. 200f.).
While, hand gestures have been shown to align with (or adapt their alignment with regard to) prosodic phrasing (e.g., Loehr, 2004; Esteve-Gibert and Prieto, 2013; Krivokapic et al., 2015), cf. broader review in Wagner et al. (2014), there is little evidence supporting the association of eyebrow movements with prosodic phrasing. In Israeli Sign Language, eyebrow movements are a key component of intonational phrasing (Nespor and Sandler, 1999). However, since spoken and signed languages make different use of the bodily resources at hand, this cannot be automatically translated to spoken languages. Granström et al. (1999) report only a very weak correlation between eyebrow movements and prosodic phrasing in their data. Swerts and Krahmer (2008) report that the upper portion of the face, including the eyebrow area, is particularly important for prominence perception compared to the rest of the face, suggesting a possible asymmetry for how gesture types relate to prosodic structure.
Additionally, the frequency of eyebrow movements seems to differ between cultures: Swerts and Krahmer (2010) found a substantial amount of eyebrow movements in Dutch news readings, Flecha-Garćıa (2010) also found a substantial amount for English lectures and dialogues. Ambrazaitis and House (2017), on the other hand, found only very few eyebrow movements in their Swedish news data. However, the comparison to Swerts and Krahmer (2010) is tentative as the annotation methods differed between the two studies, even though the data were similar. In light of their results, Ambrazaitis and House (2017, p. 111) suggest that, in their data, eyebrow movements may "not at all have a prominence function proper […], but rather represent an intensification signal which is added to a prominence" created by a pitch accent and head movement. Cavé et al. (1996, p. 2175) found that "rising-falling eyebrow movements produced by [their] subjects as they spoke were associated with F0 rises in only 71% of the cases. This suggests that eyebrow movements and fundamental frequency changes are not automatically linked […], but are more a consequence of linguistic and communicational choices".
In the present study, we investigate eyebrow movements, their presence at the time of pitch accents, and differences in accent type and prominence level for a sample of six English-speaking YouTubers. Unlike the previous studies presented so far, we are not working with manually annotated gestures, but we investigate if automatically tracked facial landmarks and expressions are correlated with pitch accents. We therefore analyze videos with OpenFace 2.0 (Baltrusaitis et al., 2018), and focus on ten facial landmarks that are tracked by the software on the eyebrows, six distance measures between eyebrow landmarks and landmarks on the upper eye, and four Action Units (AUs)—specific facial expressions first introduced by Ekman and Friesen (1978) pertaining to the eyebrows, see Section 3.1 below for more detail.
In this study we investigate several research questions:
1. Is there a correlation between the movement of the eyebrow (operationalized as the height of the eyebrow landmarks, the distance between eyebrow and eye landmarks, and the intensity of the AUs) and pitch height at any given moment in the analyses?
2. What is the probability of an AU connected to the eyebrows co-occurring with accents depending on their prominence or accent type?
3. If there is eyebrow movement in the vicinity of a pitch accent, how close is the temporal alignment between them?
We hypothesize that there will be correlations between pitch height and eyebrow movement, and that the correlations suggest that eyebrows move up with higher pitch peaks. Furthermore, we hypothesize that pitch accents with a higher prominence level and appearing later relative to the prominent syllable likely occur at the same time as an Action Unit. Both of these hypotheses are based on the importance of pitch height and gestures for expressive speech, necessary for YouTubers and other public speakers. Additionally, we hypothesize that we will find peaks in eyebrow movement in the vicinity of pitch peaks, most likely preceding them, such that the eyebrow contour would peak and then be in a fall (or already complete) by the time of the F0 peak. We also hypothesize that this pattern might be stronger in higher-prominence pitch accents, and that different speakers might show different patterns of F0-eyebrow coordination. Finally, there might also be origin-, gender- or speaker-specific differences in the way pitch accents, prominences and eyebrow movements are used, which we will explore for our dataset.
2. Materials
The data sample for this study consists of approximately 74 min of video material from six YouTubers. The videos came from YouTube in m4a format and were converted into wav files using FormatFactory (FreeTime, 2021) A subset of this sample is annotated for pitch accent placement and prominence levels (cf. Section 3.2) so that results on pitch accents are based on 3 min of annotated speech material (18 min total). Three of the YouTubers in the sample are from North America (two female—one from the US, one from Canada—, one male) and three are from England (one female, two male). All six of the YouTubers have business ventures outside of YouTube (such as books, tours, apparel companies, production companies, etc.). They have all been active on the platform for more than 10 years and grown their channels over time. Therefore, they all have considerable experience with public speaking (both online and in person at conventions), though it is likely they are not trained public speakers. Table 1 summarizes the YouTubers' abbreviations used in the text, gender, origin, channels, and current subscriber count (date of subscriber count collection: February 8, 2022). The YouTubers were selected randomly to reflect a range of popularity with at least over 2 million subscribers. The videos were also selected randomly from the channels. The absence of sound effects and background noise in the majority of each video was priority. A range of topics is included, but all have emotional significance to varying degrees for the speaker.
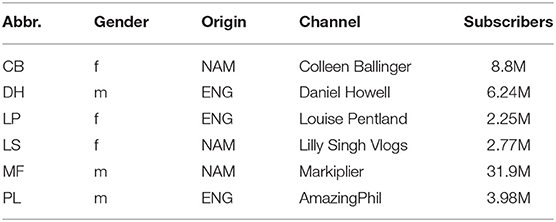
Table 1. Overview of YouTubers in sample, including identifying abbreviations, gender (f, female; m, male), origin (NAM, North America; ENG, England), channel with the analyzed video, and subscriber count of that channel (in million, obtained February 8, 2022).
All of the videos can loosely be categorized as vlogs (video blogs), where the YouTuber speaks directly into the camera more or less spontaneously, and talks to the audience member on the other side of the screen about a topic that is important to the YouTuber and their followers. These types of videos usually focus on interacting with the audience and calling the audience to join the community by subscribing or interacting with each other in the comment section of the video. All videos can be found on YouTube on the respective channels (see Ballinger, 2017; Howell, 2017; Pentland, 2017; Singh, 2017; Fischbach, 2018; Lester, 2018), but the videos are also provided in a playlist listed below.
3. Analysis I: Eyebrow Position and Pitch Accents
3.1. Eyebrow Movement Analysis—OpenFace 2.0
In this investigation, eyebrow movements are tracked using OpenFace 2.0 (Baltrusaitis et al., 2018). OpenFace is an open access toolkit for the analysis of "facial landmark location, head pose, eye gaze, and facial expressions" (Baltrusaitis et al., 2018, p. 59, italics in original). Relevant for this study are facial landmark locations and facial expressions (Action Units). OpenFace's typical analysis uses a frame rate of 30 Hz (Cannata et al., 2020), but the outputs of the current analysis were not so consistent, ranging from 25 frames per second to 60 frames per second, which is likely caused by the inherent frame rate of the videos.
OpenFace tracks landmarks on the face, taking into account head pose as well. There are 5 landmark measurements for each of the eyebrows (in pixels) with x- and y-coordinates, of which we are only including the y-coordinates for vertical movements. Landmark y17 refers to the y coordinate of the left-most point of the eyebrow that is on the left of the video frame, while landmark y26 corresponds to the y coordinate of the right-most point of the eyebrow on the right of the video frame. This is shown in Figure 1, which is a representation of all facial landmarks recorded by OpenFace, as an example for the first analyzed frame of speaker PL. The landmarks referring to the eyebrows are marked in red. In order to gather more information on eyebrow movement, the distances between six of the eyebrow landmarks and landmarks on the eyes are also included following Nasir et al. (2016). In this way, we can also confirm that the movements of the landmarks are mostly connected to eyebrow movement, and not epiphenomena resulting from head movements. The distances are marked in green in Figure 1.
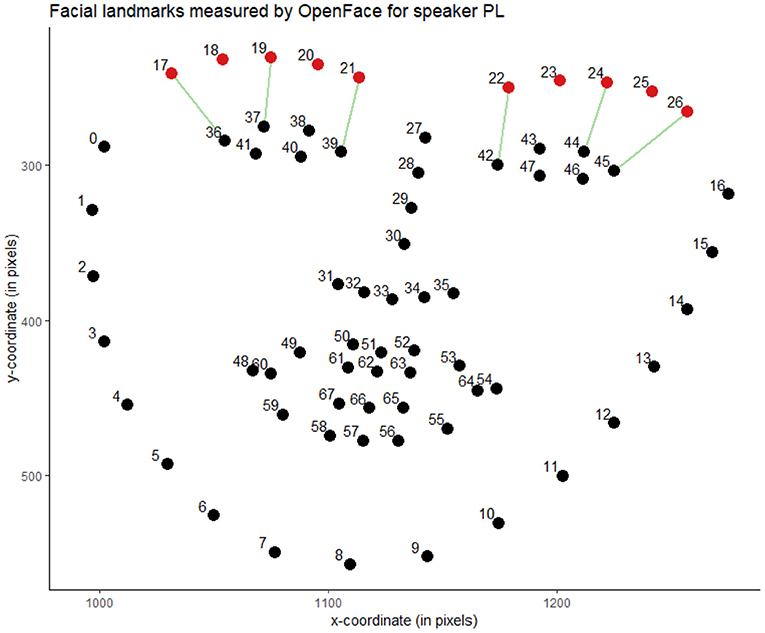
Figure 1. The facial landmarks measured by OpenFace, exemplified for the first frame of the video featuring speaker PL (Lester, 2018). The eyebrow-specific landmarks are highlighted in red, and the numbers used in the analyses to refer to the landmark coordinates are indicated. The green lines represent distances measured between two facial landmarks.
OpenFace also tracks so-called Action Units (AUs), based on the Facial Action Coding System by Ekman and Friesen (1978). AUs are stretches of time where some type of action happens on the face as a gesture. We analyze four different AUs connected to the eyebrows: inner brow raiser (AU01), outer brow raiser (AU02), brow lowerer (AU04), and upper lid raiser (AU05)—the latter is at the same time likely also associated with a widening of the eyes. OpenFace creates frame-by-frame pictures of aligned faces which feature only the face in the same position regardless of headpose, sized 112 by 112 pixels (Baltrusaitis et al., 2018, p. 63). OpenFace furthermore returns two variables for each of the AUs: whether or not they are present or absent in every analyzed frame, and the intensity on a scale of 0–5 which the action occurs with. Previous studies found that OpenFace performed AU detection at higher-than-chance levels, for posed datasets as well as videos collected "in the wild" from YouTube (Namba et al., 2021a). However, at least for still images, the accuracy drops when the face is angled at 45°, but still higher than chance (Namba et al., 2021b). Examples of the four Action Units are provided in Figure 2. The examples are taken from the aligned faces of three of the analyzed videos (Howell, 2017; Singh, 2017; Fischbach, 2018) and are examples of the specific AUs with the highest intensity when only one of the four AUs was detected, and not a combination of them.
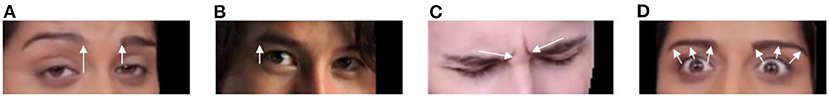
Figure 2. Examples of the four Action Units (AUs) investigated in this study, taken from the aligned faces extracted by OpenFace: (A) AU01 (inner brow raiser, measured intensity: 2.51); (B) AU02 (outer brow raiser, measured intensity: 1.06); (C) AU04 (brow lowerer, measured intensity: 3.46); (D) AU05 (upper lid raiser, measured intensity: 3.07).
We extracted the default data of an OpenFace analysis, but we are focusing our analysis on only a subset of the extracted features: the y-coordinates of the 2D facial landmarks 17–26 (eyebrows); additionally the y-coordinates of the upper lid landmarks 36, 37, 39, 42, 44, and 45; as well as the presence and intensity measures of Action Units 1, 2, 4, and 5.
3.2. Pitch Accent Annotation With DIMA
In order to investigate the relationship between prosodic structure, prominence, and eyebrow movements, pitch accents were annotated using the German consensus system DIMA (German intonation: modeling and annotation, Kügler et al., 2015, 2019; Kügler and Baumann, 2019). While, this system was created as an intonation annotation system for German, it is inherently based on a phonetic annotation: labels are placed when pitch movement can be heard by the trained annotators. In a second step, they are aligned and adjusted with the help of the visual pitch contour in Praat (Boersma and Weenink, 2018). Unlike other systems for intonation annotation like ToBI, there are no phonological decisions made at the time of the annotation, but they are possible in a second step (see Kügler et al., 2019 for a comparison of DIMA with other intonation annotation systems). Therefore, the system can be easily applied to other languages such as in this case, English.
The following description of the annotation process is a general summary of the elements of DIMA. All information hereafter is based on the annotation guidelines—in German—by Kügler and Baumann (2019). Only the symbol inventory relevant for this study is included. For all other elements of the system, please consult the guidelines or the overview of the system's symbol inventory in Kügler et al. (2019).
DIMA works with a minimum of six annotation tiers. Two of these tiers—a word-level and a syllable-level segmentation of the speech material—should be available before the start of the intonation annotation. The DIMA-specific tiers are a phrase level, a tone level, a prominence level, and a last tier for comments where uncertainties and observations can be noted. In a first step, all labels are placed purely on an auditory basis, and are then adjusted and aligned with the visible pitch contour. The labels are placed in a specific order of tiers. First, minor and major phrases are delimited by boundaries on the phrase tier (based on pauses, phrase-final lengthening, F0 reset, and the strength of the audible break). Next, prominent syllables are identified, and their strength is annotated; the strength of a prominence is referred to in the rest of the work as prominence level. Non-prominent syllables are not labeled at all. Weakly prominent syllables are labeled "1". Syllables with a strong prominence get the label "2". Usually, prominences of level 2 are associated with an accent tone, though there can be exceptions. Extra-strong or emphatic prominences are labeled "3". These prominences are labeled when an accent tone occurs and additionally, the prominence is increased by other factors like, for example, extreme pitch height, extreme loudness, segmental lengthening of the consonant onset or the vowel of the prominent syllable, etc. (cf. Kohler and Niebuhr, 2007; Niebuhr, 2010). Segmental lengthening was perceptually determined. Measurements were carried out in a next step.
Finally, after the prominences, the tones are labeled on the tone tier. Tones are labeled with a "H" for high tones and "L" for low tones, plus frequently occurring diacritics. There are three types of tones:
- Boundary tones (placed at the same time point as the boundary labels on the phrase tier),
- Accent tones (placed at pitch accents, F0 maximum, or minimum), and
- Non-accent tones (placed at turning points—maxima or minima—of the pitch contour between pitch accents).
The tones are modified by diacritics in reference to the last tone of the same quality (high or low) that occurred before, though these modifications usually occur with high tones, marking downstep and upstep ("!" and "'́, respectively).
The current study only investigates high accent tones, including tones with an upstep or downstep. We do not make major functional distinctions here, although the degree of prominence might partly account for the contrast between broad and narrow focus. Accent tones are labeled with an asterisk (e.g., H*) to mark the association of the tone with the prominent syllable. Accent tones will also be referred to as pitch accents in the remainder of the study. The placement of the accent tone in reference to the prominent syllable is also annotated. The starred tone label is always placed in the prominent syllable. If the F0 maximum occurs in the prominent syllable, the label is placed on the maximum. If the maximum occurs in the syllable before or after the prominent syllable, but is still associated with the prominent syllable, the H* label is placed in the center of the prominent syllable. A second label with a diacritic is then placed at the maximum in the syllable before (>) or after (<) the prominent syllable.
3.3. Data Treatment
All data treatment procedures were carried out in R Studio (RStudio Team, 2021). The raw OpenFace results for each video were reduced to the information relevant for the study: frame, timestamp, confidence, landmarks y17-26 for eyebrow height, and y36, y37, y39, y42, y44 and y45 for the distance measures, as well as AU01/02/04/05_r for the intensity of these Action Units, and AU01/02/04/05_c for their presence or absence. The timestamp column was also used to extract fundamental frequency (F0) measurements at the same timepoints that OpenFace measured. The F0 measurements were extracted by a Praat (Boersma and Weenink, 2018) script written by the authors. It extracted the F0 value at the timestamp both in Hertz (Hz) and in semitones re 100 (st).
The two datasets (OpenFace and F0 measurements) were processed and merged in R. The first round of data processing was run for each speaker individually. When the Action Unit intensity was smaller than 0.01, the value of the corresponding presence column was set to 0. When the intensity was bigger or equal to 0.01, the corresponding value in the presence column was set to 1. Duplicate rows were excluded by checking the frame number. Additionally, frames where the confidence of the OpenFace algorithm was below 0.85 were also excluded from the data (following Yunus et al., 2021). For two speakers (DH and PL), sections of the original video with scripted content, sound effects or background music were excluded from the dataset as well. The first 1.3 s of material from speaker LS were also excluded as OpenFace tracked the Smiley face on the speaker's shirt instead of her face. This was checked by visually inspecting the aligned faces images saved by OpenFace. Once this was finished for all speakers, the separate datasets were bound into one large dataset. The dataset was saved and the timestamps were manually adjusted with the original frame rate in a new column for all speakers so that no gaps with excluded frames appear in visualizations. Finally, columns with the distances between the eyebrow landmarks and the landmarks of the top eyelids were calculated by subtracting the eyebrow landmark location from the eye landmark location.
The pitch accents and their distance from the AUs were also measured. A Praat script written by the authors added the AUs as annotations into the Praat TextGrid that already contained the DIMA annotation. For each of the four AUs, two TextGrid tiers were added: one interval tier where the beginning and end of an Action Unit was annotated, labeled with the AU abbreviation, and one point tier where each measured timepoint was labeled with the intensity of the AU, only when an AU occurred. Figure 3 shows an example annotation of the DIMA annotation and the added AUs. The tiers with the AU intensities at each timestamp are not included in Figure 3 for ease of reading. Another script then measured for each pitch accent if there was an active AU at the time of the pitch accent and, if so, what the time distance was between the accent and the beginning/end of an AU. If there was no AU at the time of the accent, the time distance to the beginning of the following and the end of the preceding AU was measured. All time distance measurements were calculated twice in order to compare results for different labeling positions: once for the time of the pitch accents' association to the prominent syllable, and once for the time of the pitch peak (which could occur either within the prominent syllable, or the syllable before or after). The prominence levels of the pitch accents were measured in a separate step, as were the pitch values at the time of the pitch peak. The three resulting datasets were then merged for further data processing.
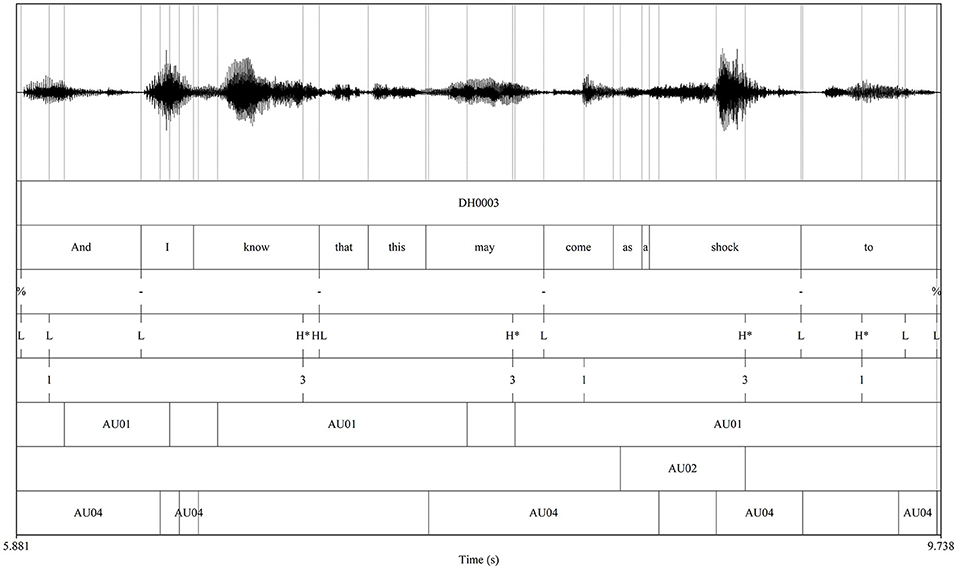
Figure 3. An example annotation with DIMA and the AUs added by a script. Boundaries for the AU intervals were placed at the first and last points an AU occurred. For ease of readability, the AU05 tier is removed here as it was not present in the selection.
The same data that was removed in the OpenFace dataset was also removed for the PitchAccent data. For this study, as mentioned above, only high pitch accents were included in the analyses, and therefore a subset was created. The numerical prominence levels (1, 2, 3) were renamed into their connected categories "weak", "strong", and "emphatic"; the levels and the category names will be used interchangeably throughout the analysis. Values of time differences between an accent outside an AU and the beginning/end of the nearest AU were excluded if the time distance was more than 3 s away from beginning/end, following Flecha-Garćıa (2010). The remaining values were counted as occurring in the vicinity of an Action Unit. The PitchAccent data comprise around 180 s of speech material for each of the six speakers, the amount that DIMA annotations are available for.
In total, 49 pitch accents were removed because pitch could not be measured. Additionally, 5 data points were lost while building the PitchAccent dataset. The exclusion of OpenFace data with a confidence below 0.85 caused the removal of 534 rows across all speakers, the majority with speakers DH and PL. Table 2 shows the measuring points that were left in the OpenFace data after data processing, as well as the number of pitch accents and measuring points within the 3 min of annotated DIMA material per speaker together with the actual length of annotated material. Note that speaker MF has over twice the amount of measuring points as the other speakers. We assume that this comes from the internal frame rate used for his video, and that the other speakers used different frame rates. The OpenFace settings were the same for all six speakers.
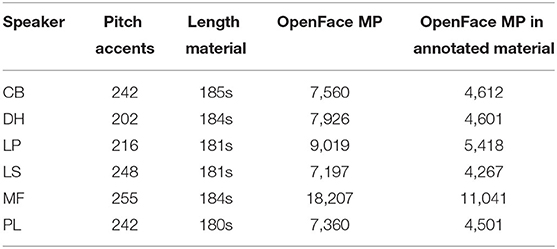
Table 2. An overview of the analyzed material including speaker abbreviation, the number of pitch accents and the length of DIMA-annotated material per speaker as well as the number of measuring points (= MP) of the OpenFace analysis both for the full video (after the exclusion of frames because of measuring issues or low confidence, see description above) and for the length of the annotated material.
3.4. Results
Several statistical approaches are combined in this study which are reported in the corresponding sections below. Section 3.4.1 will first look at the correlations between pitch height and the intensity of Action Units, the eyebrow-specific facial landmarks, as well as the distances between eyebrow and eye landmarks. Then, the results from binomial regression models investigating the likelihood of a pitch accent occurring at the same time as an AU are investigated in Section 3.4.2.
3.4.1. Correlations of Pitch and Eyebrow Movement
We carried out Pearson correlations between pitch (in semitones) and the intensity of the Action Units, the eyebrow-specific facial landmarks as well as the distances between the eyebrow- and eye landmarks using the cor.test() function in R and visually corroborated them with scatter plots. The correlations were run on subsets of the data containing only one of the four Action Units or only the landmarks. Thus, zero values due to non-existence of the specific Action Unit could be excluded without losing data when other Action Units were present. Pitch measures that were undefined because pitch could not be measured (due to creaky voice or unvoiced segments) were excluded. Therefore, the correlations and their visualizations are investigating what the correlation is when there is measurable pitch and there is an Action Unit. The same is the case for the landmarks and landmark distances: we look at correlations of eyebrow movements when there is measurable pitch. This analysis was run for OpenFace and pitch data of the entire video durations, meaning about 74 min total (after exclusion of scripted material and analyses with lower than 0.85 confidence).
Table 3 summarizes all correlation coefficients for each of the speakers. Significant correlations are shaded (p ≤ 0.05). All of the speakers had at least one significant correlation for pitch with an Action Unit, and at least three significant correlations for pitch with an eyebrow-specific facial landmark. The significant correlations between AUs and landmarks with pitch differ depending on the speaker, as does the strength of the correlation and also, for AU01 and AU02, the direction of the correlations.
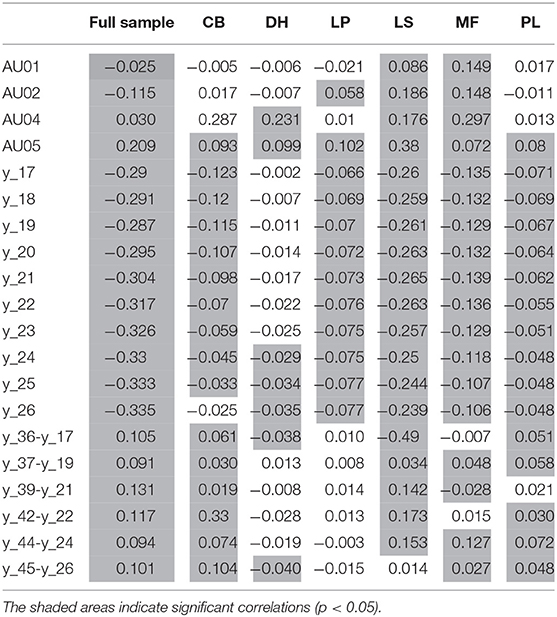
Table 3. Correlation coefficients for the correlations between pitch (in semitones) with the Action Units (AU01–AU05) and the eyebrow-specific facial landmarks (y_17–y_26) for each of the six speakers. Additionally, the correlations between pitch and the distances between the eyebrow and the eye landmarks—used as a measure for eyebrow movement—are included.
AU05, the upper lid raiser, is the only Action Unit with significant correlations across all speakers. This correlation is positive for all speakers, suggesting that the higher the pitch is, the more intense is the raising of the eyebrows. Figure 4 shows the correlations between pitch and AU05 for each of the speakers.
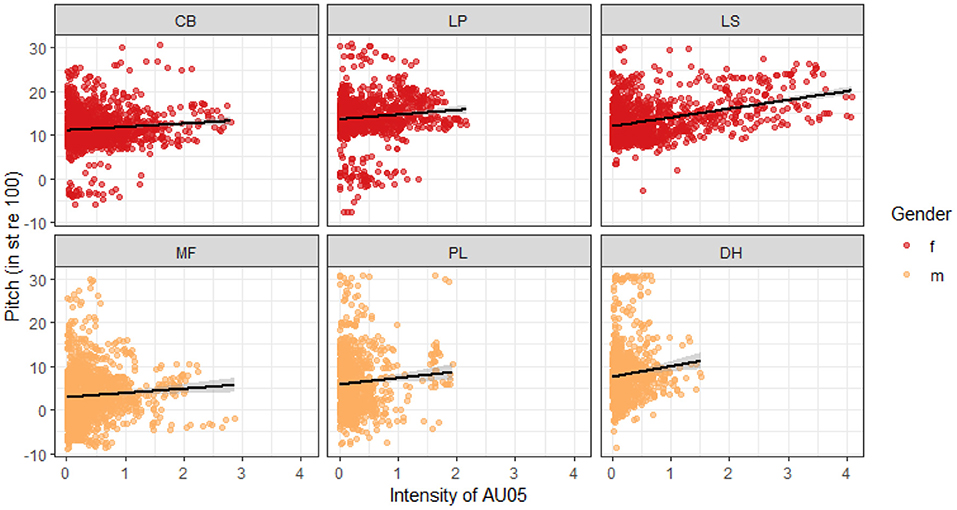
Figure 4. Correlations between pitch (in semitones) and the intensity of AU05 (upper lid raiser) for each of the six speakers.
Additionally, the facial landmark for the middle brow marker of the rightmost brow in the video (y_24) and the one next to it to the right (y_25) are the only two facial landmarks that show significant correlations with pitch for all speakers. A lower pixel value on the y-axis corresponds to a higher placement of the landmark in the face (cf. Figure 1). The correlations of y_24 and y_25 are negative for all speakers, suggesting that the pixel value is lower the higher the pitch is. Keeping in mind the actual correspondence of pixel value to landmark placement, that actually means that the eyebrows are higher when the pitch is higher. Figure 5 illustrates the correlations of landmark y_24 for each of the speakers.
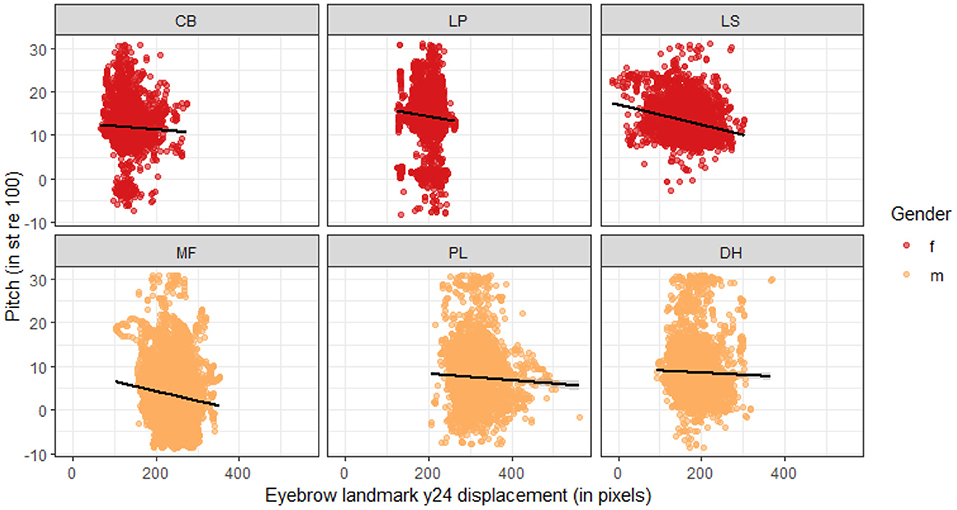
Figure 5. Correlations between pitch (in semitones) and the displacement of the eyebrow landmark y_24 (middle landmark on rightmost eyebrow, in pixels) for each of the six speakers. Negative correlations correspond to a raising of the eyebrow landmark as pitch increases: The y-coordinates have lower values the higher the landmark is in the video frame, and thus the face.
Speakers MF and LS have significant correlations for pitch with all 14 other features, both AUs and facial landmarks (all p ≤ 0.001). These two speakers also consistently have the strongest correlation coefficients, LS stronger than MF. Additionally, speakers LP and PL's correlations of pitch with facial landmark features are all significant (all p ≤ 0.002). This is similar for speaker CB, with the exception of the correlation of pitch with the rightmost eyebrow landmark (y_26) which is not significant. For speaker DH, only the three facial landmarks to the right of the video frame (y_24–y_26) are significant (all p ≤ 0.05).
The speakers from North America (MF, LS, and CB) have stronger correlations than the other three speakers from England. These three speakers from North America consistently have correlation coefficients stronger than 0.1. For the speakers from England, this is not the case. Speakers DH and LP each have one correlation of comparative strength (all other correlation coefficients are weaker than 0.1), speaker PL does not have any correlation coefficients above 0.1. There is no obvious pattern according to gender.
The distances between the eyebrow and eye landmarks overall correlate significantly with pitch in semitones (all p < 0.001). The correlations of most of the distances are positive, suggesting the higher the pitch, the larger the distance between the two facial landmarks. Only the distance between the rightmost eyebrow landmark (y_26) and the rightmost eye landmark (y_45) was negatively correlated, suggesting that as the pitch increased, the distance between the two landmarks got smaller.
While the correlations are significant for the sample as a whole, there are strong differences between speakers. For speaker LP, none of the correlations between distance measures and pitch were significant. For all other speakers, there were at least two significant correlations. Speaker DH has significant correlations for the two outermost eyebrow landmarks (y_17 and y_26) with the respective eye landmarks. Both of these correlations are negative. For the other four speakers, the significant correlations differ between landmarks. However, all four speakers have significant positive correlations of the center eyebrow landmarks (y_19 and y_24) with the respective eye landmarks (y_37 and y_44) in common, suggesting that for these speakers, the middle part of the eyebrows tends to be raised when the pitch is higher. Another observation is that the two speakers with few to no significant correlations are two of the three speakers from England in the sample, perhaps hinting at less facial expressivity (at least in terms of eyebrow movements) for English speakers compared to North American speakers.
Since we expect greater expressivity to be associated with more perceived charisma (see, for example, Niebuhr et al., 2020), a PASCAL score (Prosodic Analysis of Speaker Charisma: Assessment and Learning) was calculated based on 38 acoustic-prosodic parameters weighted by the PICSA algorithm (Niebuhr et al., 2017; Niebuhr, 2021). The measurements going into the analysis were mean values and absolute frequencies calculated for the first two of the 3 min of annotated speech material for each of the six speakers. The charisma score is a number between 0 and 100. All of the six speakers are close together in their scores (see Table 4), around the middle of the score scale. The speaker with the highest charisma score in the sample (DH) had the fewest correlations between pitch and AUs or facial landmarks. The speaker with the second-highest charisma score (MF) and the speaker with the lowest charisma score (LS) have the most correlations of all speakers, suggesting expressive pitch and expressive eyebrows.
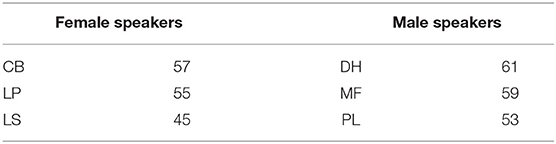
Table 4. PASCAL scores for the different speakers in the sample (out of 100).
3.4.2. Likelihood of Pitch Accent Occurring During Action Unit
We also ran binomial regression models with the glmer() function (Bates et al., 2007) in R. This method tests if a pitch accent of a certain prominence level (weak, strong or emphatic) can predict the presence or absence of an Action Unit. The models were calculated both for the position of the pitch peak (within the prominent syllable, or in the syllable before or after the prominent syllable) as well as for the time of a prominent syllable each pitch peak was associated with. Additionally, we ran further binomial regression models testing if a pitch accent of a certain type (early, medial, late) can predict the presence or absence of an Action Unit. These models were only calculated for the time of the position of the pitch peak. All models contained the speaker as a random factor. The models performed best when compared to a model without random factor and to a null model (established by a smaller AIC value, e.g., for AU01 and accent type: AICnull = 1949.1, AICglm = 1948.3, AICrandom = 1911.6). There was no significant difference between the models referring to the pitch peak or the prominent syllable, so only the results of the models referring to the position of the pitch peak will be reported. Examples 1 and 2 below show the R formulas used for the binomial regressions of AU05 with prominence level and accent type.
The binomial regression models revealed no significant effects of the prominence level. The presence of a pitch accent with a particular prominence level therefore does not predict the occurrence of an Action Unit (all p ≥ 0.1). This can also be seen visually in Figure 6, where pitch accents seem to co-occur with AUs, but sporadically and with no obvious prominence pattern. Therefore, there seems to be no one-to-one correlation between the presence of a pitch accent of any prominence level and the presence of an Action Unit. However, we assume that there is a correlation with the accent type and an AU.
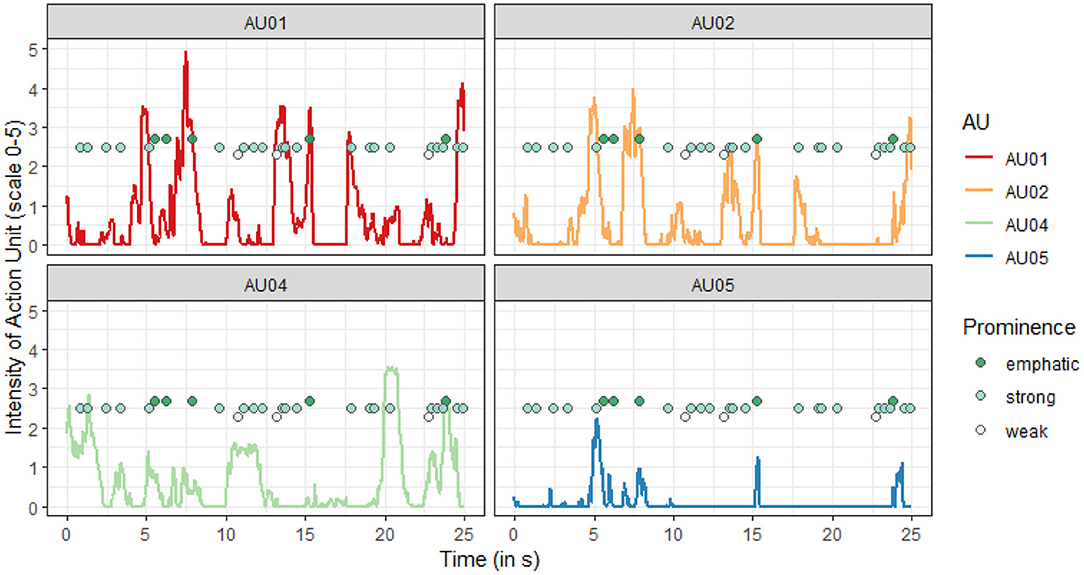
Figure 6. Co-occurrence of Action Units and pitch accents with their prominence level (example). The intensity of each of the four Action Units (scale of 0–5) is shown for the first 25 s of speech material of speaker MF. The pitch accents and their prominence level are super-imposed, the y-axis does not refer to the prominence level directly, but emphatic accents are placed higher than accents with strong prominence, which in turn are placed higher than accents with weak prominence. The time of the pitch accents is that of the pitch peak, so either within the prominent syllable, or in the syllable before or after.
For accent type, the binomial regression models revealed significant effects for AU01 (inner brow raiser) and AU05 (upper lid raiser). There were no significant effects for the other two AUs. The model for AU01 suggests that the presence of a medial pitch accent (H*) predicts the occurrence of an inner brow raiser (z = 2.118, p = 0.03). For AU05, the model suggests that not only does the presence of a medial peak predict the occurrence of an upper lid raiser (z = −2.807, p = 0.005), but that the presence of a late peak (H* <) likewise predicts the occurrence of an upper lid raiser (z = −4.398, p < 0.001). Visually, this result is not obvious, though, at least not in the example (see Figure 7).
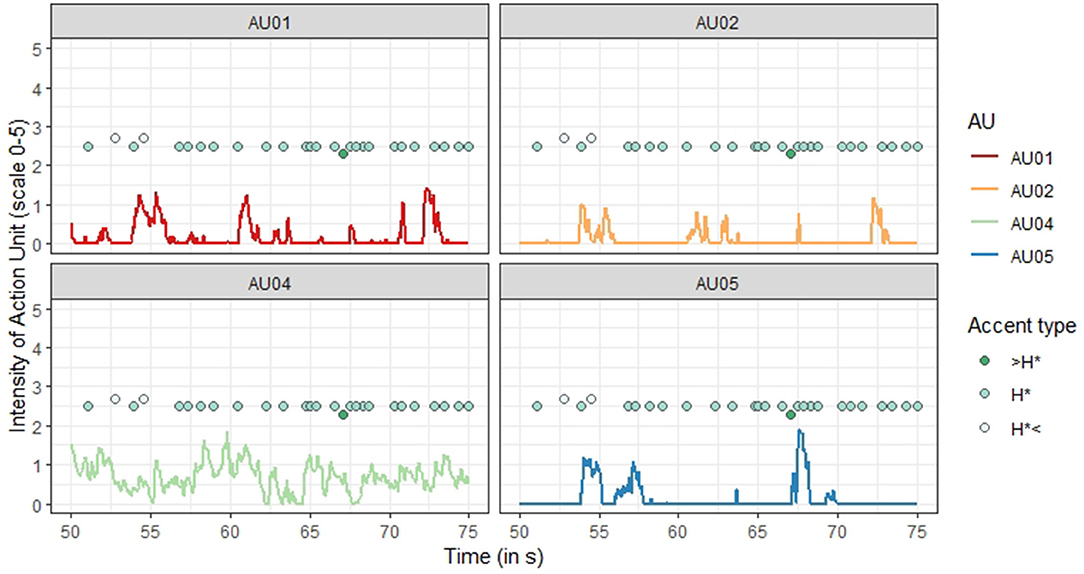
Figure 7. Example of the occurrence of Action Units and pitch accents with their position relative to the prominent syllable. The intensity of each of the four Action Units (scale of 0–5) is shown for the first seconds 50 to 75 of the speech material of speaker LP. The pitch accents and their type are super-imposed, the y-axis does not refer to the accent type directly, but late peaks in the syllable after the prominent syllable (H* <) are placed higher than pitch peaks within the prominent syllable (H*), which in turn are placed higher than early peaks in the syllable before (>H*).
Additionally, the fact that the models with speaker as a random factor performed better than the models without suggests that the speaker is also a source of substantial variation which cannot be accounted for by the prominence level or accent type.
The logistic regression models only test the presence or absence of an AU at the time of the peak. To investigate the actual timing of pitch accent peaks and eyebrow movement peaks, the next analysis, in Section 4, looks at AUs in the vicinity of pitch accents, taking prominence into consideration.
4. Analysis II: Functional Data Analysis
The degree to which different states (e.g., high F0 or raised eyebrows) occur at a specific point in time is not the only parameter of interest in an investigation of timing. The degree to which changes in these parameters may correlate with each other across time also plays an important role. For example, the claim that eyebrow movements are aligned with F0 movements (Flecha-Garćıa, 2010) suggests that a rise in F0 should be simultaneously accompanied, or perhaps preceded by at a relatively fixed time point, by a lifting of the eyebrows. In order to test such a hypothesis, methodologies are needed which can investigate the relationships between data in the form of contours rather than individual points. One such collection of methodologies is assembled under the name of Functional Data Analysis (FDA) (Ramsay and Silverman, 2005).
Functional Data Analysis is a set of methodologies allowing for the extension of classic statistical tools to the domain of functions. Entire contours—represented by functions—are the input to the analyses, rather than data points. Since the analysis is conducted automatically with minimal input from the analyst, this method is much less prone to subjective bias, and can also identify patterns which may not immediately arise from a visual inspection of the data.
FDA has been used to model variation in prosody across a variety of domains and languages, including the investigation of tone dynamics in Taiwan Mandarin (Cheng et al., 2010; Cheng and Gubian, 2011); the analysis of intonational categories in, for example, Italian (Turco et al., 2011) and Greek (Lohfink et al., 2019); and the analysis of F0 variation in the context of new-topic initiation in Southern British English (Zellers et al., 2010). Multidimensional analyses, involving more than one contour, are also possible. Thus FDA has also been used to investigate formant transition features. First and second formants are used together to distinguish contexts with deleted schwas from contexts where no schwa was present in French (Gubian et al., 2009) as well as to distinguish diphthongs from pairs of adjacent vowels in Peninsular Spanish (Gubian et al., 2015). A combination of the parameters F0 and speech rate was used to investigate how first language prosody influences production of hyperarticulation of prosody in a second language (Asano and Gubian, 2018).
We carried out an instrumental acoustic analysis of the pitch contours and the eyebrow movements using tools from Functional Data Analysis. The specific analysis carried out was a Functional Principal Component Analysis (FPCA). Principal component analysis takes a multidimensional dataset and uses orthogonal transformations to make sources of variation more accessible; this can be visualized as replotting the data on a new set of axes, which are the dimensions along which the most variation is present in the data. These new axes are the Principal Components (PCs). In FPCA, the PCs allow us to visualize aspects of contour shape which are mathematically relevant to the variation across a set of contours.
The FPCA was carried out in R (RStudio Team, 2021) using the scripts provided by Michele Gubian (available https://github.com/uasolo/FDA-DH/).
4.1. Data and Methodology
The input to the FPCA analysis comprised two datasets which were coordinated in time. The data were selected by locating the F0 peaks annotated for the first portion of the analysis (see Section 3.2). A time window of 1 s was identified with the F0 peak falling exactly in the middle (i.e., the window extended 500 ms to the left and to the right of the F0 peak). A 1-s window was chosen as a window that was large enough to potentially identify some systematicity in the forms of the contours while not overlapping too much with movement associated with adjacent pitch accents; since the mean distance between adjacent pitch accents varied between speakers from 0.61 to 0.83 s in the current data, a smaller window might have been even more ideal, but might have resulted in too much data loss to be able to carry out the analysis.
In order to align the video and the audio measurements, the time points used to extract the points comprising the contours were determined based on the output of the OpenFace analysis, which were 4 ms apart, resulting in a maximum of 25 time points per sample. The time points at which measurements of the eyebrow position were available were extracted from the OpenFace data. Using a Praat script, F0 measurements were taken at time points which fell within the windows identified around the F0 peaks; the measurements were taken in semitones re: 100 Hertz using Praat's automatic parameters. These F0 measurements were then re-combined with the eyebrow movement data in R, resulting in parallel simultaneous measurements for F0 and the four tested AUs at the times surrounding the F0 peaks. In this way, "contours" were created for both features, where the X-value was the time point, and the Y-value respectively either the F0 measurement or the value of the AU (between 0 and 5).
Since the stretches of speech were not controlled in terms of their segmental content, some of the extracted F0 values were missing due to voiceless segments or creaky voice. For cases where the missing values fell between existing values, the missing values were linearly interpolated. If the missing values were at the beginning or the end of the sample and could not be interpolated, those time points were deleted from the sample, meaning that some samples were shorter than 1 s. In order to ensure that the samples were still long enough to be meaningful, only samples with at least 19 remaining time points were kept in the analysis. This resulted in 393 pitch accents for which a usable pitch contour existed.
Since we were particularly interested in the coordination of eyebrow movements, we also excluded cases in which the Action Unit value had a non-zero value in fewer than 10 of the datapoints. Since there were 4 tested AUs, this meant that a particular pitch accent unit might not appear in the analysis for, say, AU01, while still appearing in the analysis for AU04, if there were non-zero values for AU04 but not for AU01 for that pitch accent. The total number of contour pairs available for each Action Unit is shown in Table 5.
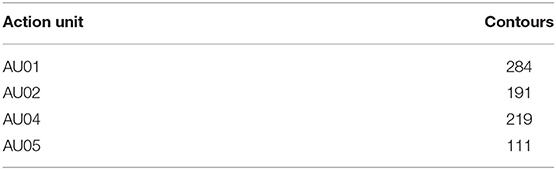
Table 5. Number of usable contour pairs for each Action Unit.
The FPCA analysis was carried out separately for each Action Unit, so each analysis involved a pair of contours: i.e., the F0 contour and the contour for one AU.
The analysis requires that all contours have the same duration. Since this is not the case due to the removal of some time points, a time-normalization must be carried out: the mean duration of all of the contours is calculated, and all contours are then normalized to this mean duration by either spreading out pitch points (to lengthen a contour) or moving them closer together (to shorten a contour). Thus the contours used as input for the analysis all have the normalized duration of 1 s, even if points were removed originally. It is possible to adjust the time-normalization process using additional time landmarks, e.g., segment or syllable onsets or offsets, but since the segmental content of these data were essentially random, no landmark registration was carried out for the current analysis.
Following this time normalization, a smoothing process is carried out. All of the contours are re-described using a common B-spline basis. A B-spline is a "piecewise" function, which is continuous at specified locations called knots. By linearly specifying the B-spline chunks, the intonation contours can be re-represented as smoothed functions. The number of knots as well as an additional smoothing parameter λ both impact the degree to which the contours are smoothed. There are several methods of determining optimal values for the number of knots and λ; the current study used a Generalized Cross-Validation method, which creates a visual representation of the relative amount of error at different numbers of knots and λ values. Lower values for number of knots, and higher values for λ, lead to smoother curves; the degree of smoothness that is optimal for any dataset is in this case a result of the analyst's decision, carried out on the basis of visual inspection of the data. Once the parameters for smoothing have been determined, all of the contours are smoothed using the same basis.
Functional PCA results in a compact description of the main shape variations (or Principal Components, PCs) that are present within a dataset of curves; in this case, the set of F0 contours plus the set of eyebrow movement contours. Once the PCs are identified, each original curve is associated with a PC score, which quantifies where a specific curve is located in the continuum of each shape variation described by a PC.
Once the PCs are calculated, one output of the script is a set of visualizations of contours with a range of positive and negative values for each PC. The value for the PC can be thought of as a coefficient to the equation representing the contour, starting from the mean of all contours. The output for each PC also includes an account of how much variation in the data the PC accounts for.
Since PC scores are numbers, they can be easily used in further analyses, including being correlated with manual labels, as has been shown by Zellers et al. (2010); Gubian et al. (2015). Since they are directly related to the shape of the contours, they provide an objective method of identifying consistency and variability across a set of contours.
In the current study, in addition to the visual output of the PC analysis, we tested the output PC values against the prominence of the pitch accent as well as the identity of the speaker (to look for individual differences in alignment of eyebrow movement and F0).
Previous literature reported temporal coordination between eyebrow movements and F0 movements, and specifically, that raising of the eyebrows precedes the production of a pitch accent in speech. We therefore hypothesized that we would find peaks in eyebrow movement in the vicinity of the F0 peaks, most likely preceding them, such that the eyebrow contour would peak and then be in a fall (or already complete) by the time of the F0 peak. We also hypothesized that this pattern might be stronger in higher-prominence pitch accents, and that different speakers might show different patterns of F0-eyebrow coordination.
4.2. Results
The pitch contours and eyebrow movement contours were smoothed as described above, using log(λ) = −8, and 12 knots. Since the results for all four AUs were substantially similar, the results for AU01, the inner brow raisers, are reported throughout as representative results. The first three PCs are shown in Figure 8.
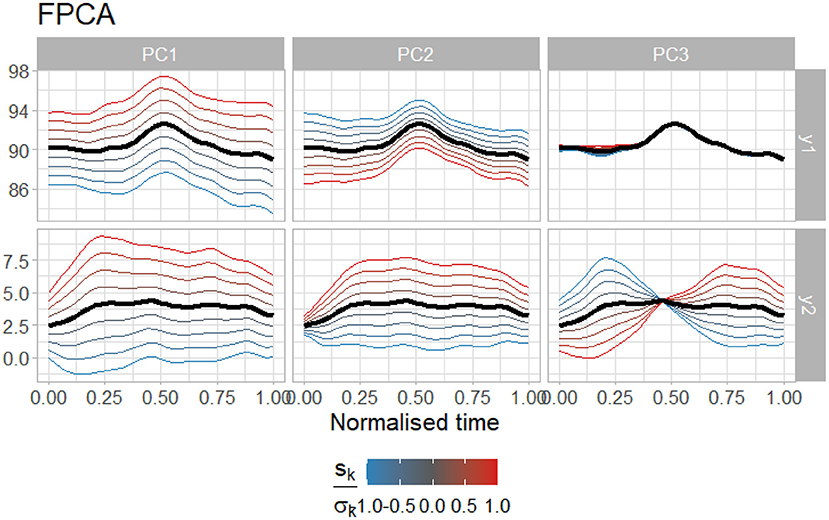
Figure 8. The first three PCs resulting from the FPCA analysis of F0 with AU01. The top row (y1) shows the variability in F0, and the bottom row (y2) shows the variability in eyebrow movements. The black line shows the mean of all contours, while the red lines show contours with a high positive value for the given PC, and the blue lines show contours with a low negative value for the given PC. Note that the red and blue lines do not show density of the distributions of the PCs, and thus in some cases give non-real values (e.g., values below 0 or above 5 for y2, the eyebrow measurements.).
There are several features of interest to be observed in Figure 8. First is the shape of the mean contours, shown in black. For the F0 contours (top), a clear peak is visible; this is to be expected, given that the data were selected on the basis of the presence of an F0 peak. However, in the eyebrow data, the mean contour is relatively flat. Some slight dipping can be observed at the left and right edges, but due to the time-warping, these locations must be considered as somewhat less reliable than locations in the middle of the contour. The lack of a peak in the mean contour for the eyebrow movements indicates that, on average, there is no eyebrow peak associated with the F0 peak (at least not in the time window used in this analysis). Thus these data do not provide support for a hypothesis proposing an automatic synchronization of the eyebrow raising movement with an F0 peak. However, since the mean value for the eyebrow contours falls between 2.5 and 5, the eyebrows (specifically in the case of AU01, the inner brow raisers) are on average relatively far away from their rest position while F0 is raised. It is important to keep in mind that this dataset excluded cases where no eyebrow movement at all was detected (i.e., a flat eyebrow contour with the AU value at 0) but did include cases where the AU value was even minimally above zero, so the mean of the contours suggests that, when eyebrow movements are present with F0 peaks, they are relatively intensely expressed, at least in terms of the way the AU is calculated (cf. Section 3.3).
The next feature of interest is the coordination of eyebrow raising and F0 in the first two PCs. The first two PCs account for approximately 70% of the variability in the data (PC1: 51.2%; PC2: 20.3%). The first PC accounts for matched variability: when F0 is higher, the eyebrows are also higher, aligning with our expectations. Thus, for a high value of PC1 (red contours), F0 and the AU value are both high). However, the second PC contributes an opposite effect: when F0 is higher, the eyebrows are lower. Thus, for a low value of PC2 (blue contours), F0 is high but the eyebrows are not raised. Although PC1 accounts for more variability in the data than PC2, PC2 could have an effect that essentially partially "cancels out" the effect of PC1, if the PC2 value for a given contour is sufficiently low while the PC1 value is not too high.
PC3 accounts for only 8.3% of the variability in the data, but shows a pattern more along the lines of our expectations; that is, a slope (either rising if PC3 is positive, or falling if PC3 is negative) in the eyebrow movement that is temporally close to the F0 peak, though not associated with a relatively higher or lower F0 peak. Although the variability accounted for is small, if there is a significant association of PC3 with another predictive variable, this could still be meaningful. However, as seen in Figure 9, this is not the case. Although in some cases, e.g., DH with prominence 2, LS or MF with prominence 1, or CB with prominence 3, there appears to be a difference in behavior, these visual differences rest on a lack of measurement points in these categories (only 2–3 datapoints) and thus do not attain statistical significance in a linear mixed model. No linear mixed model on any of the three PCs or combinations thereof found a significant relationship between the PCs and the prominence level. When the individual speakers were taken as predictors instead of as random factors in the model, individual speakers were occasionally found to differ significantly for one specific prominence value. Since this was not consistent across speakers or prominence levels, we conclude that, at least in the current data, there is no evidence for a specific systematic timing relationship between the F0 peak and any possible (though unidentified) peak in eyebrow movement activity.
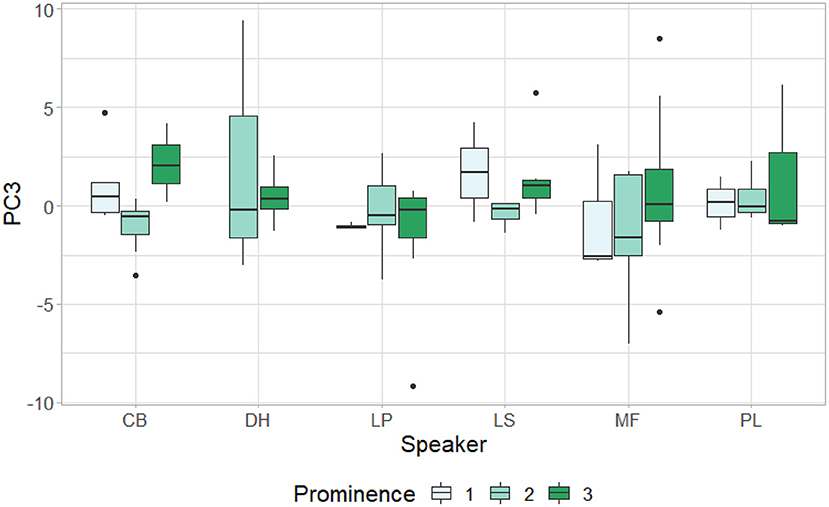
Figure 9. Values of the third PC for each speaker across prominence levels.
5. Discussion
Our first research question was if there is a correlation between the movement of the eyebrow (in terms of height for the eyebrow landmarks, the distance between eyebrow and eye landmarks, and intensity for AUs) and pitch height at any given moment in the analyses. We hypothesized that there will be correlations between pitch height and eyebrow movement suggesting that the eyebrows tend to be higher when the pitch was higher as well. This is exactly what we found, at least for some of the landmarks and Action Units.
All speakers had at least one significant correlation with an AU. The Action Unit that had a significant—positive—correlation for all speakers was AU05, the upper lid raiser. This correlation suggests that the higher the pitch is, the stronger the raising of the upper lid and therefore the eyebrow. A widening of the eyes goes along with AU05 and should be investigated in future studies.
For the eyebrow landmarks we found that each speaker had at least three significant correlations which were all negative. The only two eyebrow landmarks that have significant correlations for all speakers are the middle point on the right eyebrow and the point to the right of the middle point. However, keep in mind that the lower the pixel value of the y-coordinate that is measured by OpenFace is, the higher the landmark appears in the video. Therefore, significant negative correlations also suggest that the higher the pitch is, the higher is the eyebrow in the video frame. Overall, the three speakers from North America in the current sample have stronger correlations between pitch height and eyebrow height than the speakers from England. This is a result that should be investigated further with a larger speaker sample. However, it might suggest that speakers from North America speak more expressively (= higher and therefore more prominent pitch peaks) and use their eyebrows more intensively (= higher eyebrow raises). This could fit some stereotypes between American and British cultures, which "attribute a more extrovert, expressive style and energetic manifestation of feelings to Americans than to the British, who are widely considered to be relatively more reserved" (Lewandowska-Tomaszczyk and Wilson, 2021, p. 262).
In order to corroborate that the landmark measurements actually represent eyebrow movements, we also used distance measures between eyebrow and eye landmarks as a more direct measure for eyebrow movement, as the distance between upper eyelid and eyebrow should not be massively affected by head movements. Two speakers (DH and LP) had only few or no significant correlations between pitch and distance measures. Only the correlations between the two outer landmark distances and pitch were significant for speaker DH, who also had only three significant (weak) correlations between the eyebrow landmarks and pitch. This may suggest that this particular speaker did not use the eyebrows much, especially in combination with pitch movements, and if he does it seems to be mostly with the outer ends of the eyebrows. For speaker LP, all correlations between eyebrow landmarks and pitch were significant, but none of the distance measures were. That was an unexpected result, as it was assumed that the distance measures would in a way confirm the position of the landmarks. It seems reasonable to assume that for this particular speaker, the correlations between the position of the eyebrow landmarks and pitch are more severely affected by head position in the video frame or head movements, so that it is not necessarily the eyebrows that were raised. For future studies we therefore suggest—inspired by Yunus et al. (2021)—to use both the landmarks and calculate distances to corroborate the results.
This is now also a concern for the other four speakers in the sample. However, the other four speakers had significant correlations for at least four out of the six distance measures with pitch as well as at least nine significant out of ten correlations between eyebrow landmarks and pitch. That means that the movements captured by the landmarks seem to actually be movements of the eyebrows, at least with a higher certainty. All four speakers (CB, LS, MF, and PL) have significant positive correlations between pitch and the distance from the center of each eyebrow to the respective eye landmark. That suggests that—at least for these four speakers—the center of the eyebrows is raised when the pitch is higher. That would also fit the significant positive correlations with AU05, the upper lid raiser: when the upper lid is raised, especially the center point of the eyebrows moves away from the eyes. But there are, again, strong speaker-specific differences between the eyebrow movements and pitch height. The two speakers who did not have significant correlations between the distances between eyebrows and eyes and pitch, or just at very few points were two of the three speakers from England, while all speakers from North America had significant correlations between several distances and pitch. This could also point toward more expressivity for American speakers and perhaps a tendency for more reservedness for speakers from England (cf. Lewandowska-Tomaszczyk and Wilson, 2021).
In general, there seems to be no specific difference in eyebrow and pitch use depending on the acoustic charisma score that was calculated for the speakers (cf. Niebuhr et al., 2017; Niebuhr, 2021). Rather, all speakers had fairly similar scores, but strong differences between correlations of eyebrow movements and pitch height. That suggests that acoustic charisma and eyebrow movements are not necessarily tied together, though it is also not dis-proven given the small dataset and the study not being directly aimed at investigating correlations with the charisma scores. However, one possible reading could be that there might be a trade-off between verbal and non-verbal charisma, as speaker LS has—with 45—the lowest charisma score but at the same time the strongest correlations between eyebrow movements and pitch. It might therefore be that she makes up for her lower verbal charisma with facial charisma. Similar results have been found for hand gestures (see, for example, Hiroyuki and Rathcke, 2016).
We also carried out binomial regression models to find out whether the presence of a pitch accent of a specific prominence level (weak, strong, emphatic) or accent type (early, medial, late) can predict the presence or absence of an Action Unit connected to the eyebrows. We found that the presence of a pitch accent with a particular prominence level does not predict the presence or absence of an AU. However, we did find that the presence of a medial pitch accent (H*, occurring within the prominent syllable) can in fact predict the presence of an inner brow raiser (AU01). This suggest some kind of co-occurrence between medial pitch accents and AU01, and while medial pitch accents are by far the most frequent accent type (as they are the default), the presence of AU02 (outer brow raiser) and AU04 (brow lowerer) could not be predicted by the presence of a medial pitch accent. So even though medial pitch accents are the default, they seem to be more connected to movement of the inner brows than of the outer brows. The presence of a medial pitch accent also predicts the presence of an upper lid raiser movement (AU05). The presence of AU05 is also predicted by the presence of a late pitch accent (H* <, occurring in the syllable following the prominent syllable). That may suggest that the upper lid raiser could be more prominent in general, as it is more likely to co-occur with non-early and therefore more prominent pitch accents because of their interpretation as "unusual occurrence" (Gussenhoven, 2002, p. 6). It is also the only Action Unit that was significantly positively correlated with pitch height for all six speakers in the sample, further suggesting the connection to prominence. AU05 raises the entire lid and therefore moves the eyebrows up entirely, which can convey a look of surprise, also fitting the "unusual occurrence" interpretation. This tends to go together with a widening of the eyes. Eyebrow raising and widening are also used to signal overarching prosody in sign languages (see Nespor and Sandler, 1999 for Israeli Sign Language), which may also hint at an interplay between the two gestures and warrant further analysis in terms of prominence.
The FDA analysis, investigating co-occurring movement between the eyebrows and F0 peaks, did not provide a conclusive result, but opened up several possibilities for future research. We hypothesized that individual eyebrow movements might be closely synchronized in time with F0 peaks, and that this synchronization might be stronger at higher prominence levels, or vary among individual speakers. However, we found no evidence supporting either of these hypotheses. This contrasts with previous reports from Flecha-Garćıa (2010), who suggests that there is a very close temporal alignment between at least the raising movement of the eyebrows and the location of an F0 peak. It is important to keep in mind that the methodology used was different, and that the previous studies used manual annotations rather than automatically extracted AUs. Since the current study could only analyze one AU at a time in relation to a pitch accent (increasing the number of dimensions of the FDA would have substantially increased processing time as well as reducing the dataset to those items where more than one AU was active), it is possible that the manual annotations were able to capture complex movements that were not reliably relayed by the OpenFace data. Conversely, manual annotators might have been unconsciously influenced by body movements or other aspects of the video signal which the automatic method employed here avoided. It might also be the case, as suggested by a reviewer, that the automatic method was sensitive to movements that were under a threshold of visual perceptibility to human raters. Since our analysis included all non-zero values for the AUs, it is possible that eyebrow movements were included that would not have been classified as eyebrow movements by a human rater. Thus, while one might claim that differences in the results are due to differences in validity of the data extraction method, it is difficult to evaluate which method might have produced more reliable data.
The current data also differ in genre from Flecha-Garćıa (2010), who uses dialogues in which participants sit face to face, a situation which was likely to encourage non-verbal signaling to the interlocutor. In the YouTube data, although the speakers are interacting with an audience, this audience is normally not visible to them, and this may have a damping effect on signaling. Previous research also found this: when interlocutors were visible to each other, speakers "were more likely to use non-redundant gestures" than speakers who could not see their interlocutor (Bavelas and Healing, 2013, p. 77, see also Alibali et al., 2001). Gestures have likewise been found to be larger when interlocutors could see each other (Mol et al., 2011). This is likely also the case on YouTube where the audience is not visible, and could explain the lack of alignment between eyebrow movements and pitch accents. The effect on other types of gestures (manual gestures, head nods, etc.) would be interesting to investigate in this light in the future. Conversely, perhaps "YouTube Face", a conventionalized method or set of methods of visually signaling engagement or emphasis, will turn out to be a visual corollary to the "YouTube Voice" which has developed in this particular speaking context.
Another crucial feature of the current study that differs from previous analyses is that it used the pitch accent as a reference point for identifying the time window in which we investigated eyebrow movement. If only the eyebrow raise, and not the subsequent fall, is closely timed to the pitch accent, then it is possible that the window of 500 ms excluded the time in which the eyebrow raise occurred; Flecha-Garćıa (2010, p. 549) reports eyebrow movements starting within ±1 s of the pitch accent. However, given that pitch accents in the current data tended to be between 600 and 800 ms apart, this seems unlikely, if there was a one-to-one correlation between eyebrow raises and F0 peaks. A one-to-one correlation is in any case not to be expected due to the extreme degree of eyebrow movement that would be involved (nor is such a one-to-one relationship found in previous work), although given the association with increased prominence found in previous studies, it might have been reasonable to find this association with the prominence level 3 accents, even if not for levels 1 and 2.
The findings in the current data appear to be more in line with a model of eyebrow movement where the eyebrows are raised and then perhaps held in the raised position over the course of several pitch accents. This would be consistent with the mean value of the eyebrow contours falling clearly in the upper range of activity for the AU, while not having a clear contour form, as this might be lost in the calculation of the average contour. Since this study investigated all eyebrow movements identified by OpenFace, it is possible that a confound arose between rapid and slow eyebrow movements, i.e., those having rhythmic or prominence functions vs. those having semiotic functions (Gua¨ıtella et al., 2009). A longer holding of the eyebrow movements might correlate better with a "structuring" function for eyebrow movements, which Flecha-Garćıa (2010) proposes as being of similar importance to emphasis. A future investigation using FDA could investigate the shapes of eyebrow movement contours: do local eyebrow peaks analogous to F0 peaks tend to arise? Or are long plateaus of raised eyebrows more likely? Possibly excluding the F0, multidimensional analyses could also look at multiple AUs simultaneously. As suggested by the work of Kim et al. (2014), a measure of peak velocity could be a better indicator for identifying relevant eyebrow movements.
In general, as we have hypothesized, we found both speaker-specific differences and tendencies for origin differences. That suggests that the use of eyebrow movements and pitch accents is not universal, but depending on the preferences of the specific speaker. Additionally, it seems that eyebrow movements and pitch accents are more closely tied for North American speakers than for speakers from England, perhaps hinting at a difference in expressivity between the two cultures (Lewandowska-Tomaszczyk and Wilson, 2021). Gender differences were not found in this particular sample. While this is a generalization and only first impressions, we see these tendencies for our sample that warrant further investigations with a larger sample. Nevertheless, this exploration revealed that there may be origin-based differences in how eyebrow movements and pitch accents play together.
Overall, we found correlations between the height of eyebrow movements and the height of the pitch contour at the same measuring points. That suggests, as other studies have shown (e.g., Flecha-Garćıa, 2010; Ambrazaitis and House, 2017), that eyebrow movements and intonation are somewhat connected. However, unlike other studies (e.g., Swerts and Krahmer, 2010), we did not find evidence for a difference in eyebrow movement depending on the prominence level of a pitch accent. It was also not likely to have pitch accents at the same time as Action Units, at least for some of the Action Units. That suggests that pitch accents may be connected with certain types of eyebrow movements (primarily in this sample: inner brow raiser and upper lid raiser), and only for specific pitch accent positions relative to the prominent syllable (medial or late). There are, however, hints to a cultural difference between speakers from North America and England that needs further analysis. The YouTubers in the sample frequently use prominence strategies like emphatic and late pitch accents, and the visual component is integral in a video. Our results of a connection of pitch accents and eyebrow movements are tentatively positive, but require further investigations.
Future studies should expand the sample of speakers, both from North America and from England. This study was also only the first step and should be enhanced further by running perception experiments with visual, audio, and audio-visual cues to determine to what degree the eyebrows actually have an effect on the perception of expressiveness, charisma, and the overall personality of the speaker. Additionally, future investigations should also incorporate head nods and other head movement gestures. That might add another relevant level to the question of gesture-pitch alignment and could lead to a more complete picture. The information status of the verbal items could be investigated, and if there are certain co-occurrences with pitch peaks and eyebrow movements. Finally, future studies could also investigate if there is a difference in amount of AUs in the beginning, middle and end of a talk or video: especially on YouTube it is important to grab an audience from the very beginning. That might suggest that AUs are more frequent in the beginning of a video to get as much expressiveness as possible into the first section of the video to engage the viewer.
Data Availability Statement
The raw data supporting the conclusions of this article will be made available by the authors, without undue reservation.
Ethics Statement
Ethical review and approval was not required for the current study in accordance with the local legislation and institutional requirements. Written informed consent for participation was not required for this study in accordance with the national legislation and the institutional requirements.
Author Contributions
SB contributed to hypothesis development, annotated the pitch accents and prominence levels, carried out the OpenFace analyses and the data processing and statistics for Section 3. MZ contributed to hypothesis development, carried out the data processing and statistics for Section 4, and contributed to writing the paper. All authors contributed to the article and approved the submitted version.
Funding
Part of the work of SB was supported financially by the Federal State Grant Schleswig-Holstein (awarded between 2018 and 2021). We acknowledge financial support by DFG within the funding programme Open Access-Publikationskosten.
Conflict of Interest
The authors declare that the research was conducted in the absence of any commercial or financial relationships that could be construed as a potential conflict of interest.
Publisher's Note
All claims expressed in this article are solely those of the authors and do not necessarily represent those of their affiliated organizations, or those of the publisher, the editors and the reviewers. Any product that may be evaluated in this article, or claim that may be made by its manufacturer, is not guaranteed or endorsed by the publisher.
Acknowledgments
The authors would like to thank Michele Gubian for the support with the Functional Data Analysis, and Oliver Niebuhr for the calculation of the PASCAL scores. Thank you also to the reviewers as well as Kathrin Feindt for their helpful comments and suggestions. Part of the work carried out was inspired by discussions at meetings of the network Gestures and Head Movements in Language (Independent Research Fund Denmark, 9055-00004B, PI: Prof. Patrizia Paggio).
References
Akker, E., and Cutler, A. (2003). Prosodic cues to semantic structure in native and nonnative listening. Bilingual. Lang. Cogn. 6, 81–96. doi: 10.1017/S1366728903001056
Alibali, M. W., Heath, D. C., and Myers, H. J. (2001). Effects of visibility between speaker and listener on gesture production: some gestures are meant to be seen. J. Mem. Lang. 44, 169–188. doi: 10.1006/jmla.2000.2752
Ambrazaitis, G., and House, D. (2017). Multimodal prominences: exploring the patterning and usage of focal pitch accents, head beats and eyebrow beats in Swedish television news readings. Speech Commun. 95, 100–113. doi: 10.1016/j.specom.2017.08.008
Asano, Y., and Gubian, M. (2018). "Excuse meeee!!": (mis)-coordination of lexical and paralinguistic prosody in L2 hyperarticulation. Speech Commun. 99, 183–200. doi: 10.1016/j.specom.2017.12.011
Baltrusaitis, T., Zadeh, A., Lim, Y. C., and Morency, L.-P. (2018). "OpenFace 2.0: facial behavior analysis toolkit," in 2018 13th IEEE International Conference on Automatic Face & Gesture Recognition (FG 2018) (IEEE), 59–66. doi: 10.1109/FG.2018.00019
Bavelas, J., and Healing, S. (2013). Reconciling the effects of mutual visibility on gesturing: a review. Gesture 13, 63–92. doi: 10.1075/gest.13.1.03bav
Berger, S., Niebuhr, O., and Brem, A. (2020). "Of voices and votes: phonetic charisma and the myth of Nixon's radio victory in his first 1960 TV debate with Kennedy," in An den Rändern der Sprache, eds M. Elmentaler and O. Niebuhr (Frankfurt: Peter Lang), 109–145.
Berger, S., and Zellers, M. (2021). "Pitch accent position, peak height, and prominence level relative to accented vowel onset on YouTube," in Proceedings of the 1st International Conference on Tone and Intonation (Sønderborg), 137–141.
Beskow, J., Granström, B., and House, D. (2006). "Visual correlates to prominence in several expressive modes," in Ninth International Conference on Spoken Language Processing (Pittsburgh, PA: Citeseer), 1272–1275. doi: 10.21437/Interspeech.2006-375
Cannata, D., Redfern, S., and O'Hora, D. (2020). "OpenFaceR: developing an R package for the convenient analysis of OpenFace facial information," in PSYCHOBIT (Naples), 1–9.
Cavé, C., Guaitella, I., Bertrand, R., Santi, S., Harlay, F., and Espesser, R. (1996). "About the relationship between eyebrow movements and Fo variations," in Proceeding of Fourth International Conference on Spoken Language Processing. ICSLP'96 (Philadelphia, PA: IEEE), 2175–2178. doi: 10.1109/ICSLP.1996.607235
Cheng, C., and Gubian, M. (2011). "Predicting Taiwan Mandarin tone shapes from their duration," in Proceedings of Interspeech 2011 (Florence), 1073–1076. doi: 10.21437/Interspeech.2011-403
Cheng, C., Xu, Y., and Gubian, M. (2010). "Exploring the mechanism of tonal contraction in Taiwan Mandarin," in Proceedings of Interspeech 2010 (Makuhari), 2010–2013. doi: 10.21437/Interspeech.2010-569
Ekman, P., and Friesen, W. V. (1978). Facial Action Coding System: A Technique for the Measurement of Facial Movement. Palo Alto, CA: Consulting Psychologists Press.
Esteve-Gibert, N., and Prieto, P. (2013). Prosodic structure shapes the temporal realization of intonation and manual gesture movements. J. Speech Lang. Hear. Res. 56, 850–864. doi: 10.1044/1092-4388(2012/12-0049)
Flecha-García, M. L. (2010). Eyebrow raises in dialogue and their relation to discourse structure, utterance function and pitch accents in English. Speech Commun. 52, 542–554. doi: 10.1016/j.specom.2009.12.003
Granström, B., House, D., and Lundeberg, M. (1999). "Prosodic cues in multimodal speech perception," in Proceedings of the International Congress of Phonetic Sciences (San Fransisco, CA: ICPhS99), 655–658.
Guaïtella, I., Santi, S., Lagrue, B., and Cavé, C. (2009). Are eyebrow movements linked to voice variations and turn-taking in dialogue? An experimental investigation. Lang. Speech 52, 207–222. doi: 10.1177/0023830909103167
Gubian, M., Torreira, F., and Boves, L. (2015). Using functional data analysis for investigating multidimensional dynamic phonetic contrasts. J. Phonet. 49, 16–40. doi: 10.1016/j.wocn.2014.10.001
Gubian, M., Torreira, F. J., Strik, H., and Boves, L. W. (2009). "Functional data analysis as a tool for analyzing speech dynamics: a case study on the French word C'était," in Proceedings of Interspeech 2009 (Brighton), 2199–2202. doi: 10.21437/Interspeech.2009-626
Gussenhoven, C. (2002). "Intonation and interpretation: phonetics and phonology," in Speech Prosody 2002, International Conference (Aix-en-Provence), 1–10.
Hiroyuki, T., and Rathcke, T. (2016). "Then, what is charisma?: the role of audio-visual prosody in L1 and L2 political speeches," in Phonetik und Phonologie im deutschsprachigen Raum (Munich), 1–3.
Ip, M. H. K., and Cutler, A. (2021). "In search of salience: focus detection in the speech of different talkers," in Language and Speech (New York, NY: Sage Publications), 1–31. doi: 10.1177/00238309211046029
Kim, J., Cvejic, E., and Davis, C. (2014). Tracking eyebrows and head gestures associated with spoken prosody. Speech Commun. 57, 317–330. doi: 10.1016/j.specom.2013.06.003
Kohler, K. J., and Niebuhr, O. (2007). "The phonetics of emphasis," in Proc. 16th ICPhS, Saarbrücken (Saarbrücken), 2145–2148.
Krivokapic, J., Tiede, M., and Tyrone, M. E. (2015). "A kinematic analysis of prosodic structure in speech and manual gestures," in ICPhS (Glasgow).
Kügler, F., Baumann, S., Andreeva, B., Braun, B., Grice, M., Neitsch, J., et al. (2019). "Annotation of German intonation: DIMA compared with other annotation systems," in Proceedings of the International Congress of Phonetic Sciences (Melbourne, VIC: ICPhS), 1–4.
Kügler, F., Smolibocki, B., Arnold, D., Baumann, S., Braun, B., Grice, M., et al. (2015). "DIMA: annotation guidelines for German intonation," in ICPhS 2015: 18th International Congress of Phonetic Sciences (Glasgow).
Lewandowska-Tomaszczyk, B., and Wilson, P. A. (2021). "Expressive and reserved cultural linguistic schemas: British and American pride clusters," in Cultural Linguistics and World Englishes, eds M. Sadeghpour and F. Sharifian (Singapore: Springer), 261–293. doi: 10.1007/978-981-15-4696-9_13
Loehr, D. P. (2004). Gesture and intonation (Ph.D. thesis). Georgetown University, Washington, DC, United States.
Loehr, D. P. (2012). Temporal, structural, and pragmatic synchrony between intonation and gesture. Lab. Phonol. 3, 71–89. doi: 10.1515/lp-2012-0006
Lohfink, G., Katsika, A., and Arvaniti, A. (2019). "Variability and category overlap in the realization of intonation," in Proceedings of ICPhS 2019 (Canberra, ACT).
Mo, Y. (2008). "Duration and intensity as perceptual cues for naive listeners' prominence and boundary perception," in Proceedings of the 4th Speech Prosody Conference (Campinas), 739–742.
Mol, L., Krahmer, E., Maes, A., and Swerts, M. (2011). Seeing and being seen: the effects on gesture production. J. Comput. Mediat. Commun. 17, 77–100. doi: 10.1111/j.1083-6101.2011.01558.x
Namba, S., Sato, W., Osumi, M., and Shimokawa, K. (2021a). Assessing automated facial action unit detection systems for analyzing cross-domain facial expression databases. Sensors 21, 4222. doi: 10.3390/s21124222
Namba, S., Sato, W., and Yoshikawa, S. (2021b). Viewpoint robustness of automated facial action unit detection systems. Appl. Sci. 11, 11171. doi: 10.3390/app112311171
Nasir, M., Jati, A., Shivakumar, P. G., Nallan Chakravarthula, S., and Georgiou, P. (2016). "Multimodal and multiresolution depression detection from speech and facial landmark features," in Proceedings of the 6th International Workshop on Audio/Visual Emotion Challenge (Amsterdam), 43–50. doi: 10.1145/2988257.2988261
Niebuhr, O. (2021). "Advancing higher-education practice by analyzing and training students' vocal charisma: evidence from a Danish field study," in 7th International Conference on Higher Education Advances (Valencia), 743–751. doi: 10.4995/HEAd21.2021.12827
Niebuhr, O., Brem, A., Michalsky, J., and Neitsch, J. (2020). What makes business speakers sound charismatic? A contrastive acoustic-melodic analysis of Steve Jobs and Mark Zuckerberg. Cadernos de Linguística 1, 1–40. doi: 10.25189/2675-4916.2020.v1.n1.id272
Niebuhr, O., Brem, A., and Tegtmeier, S. (2017). Advancing research and practice in entrepreneurship through speech analysis-from descriptive rhetorical terms to phonetically informed acoustic charisma profiles. J. Speech Sci, 6, 3–26. doi: 10.20396/joss.v6i1.14983
Niebuhr, O., Voße, J., and Brem, A. (2016). What makes a charismatic speaker? A computer-based acoustic-prosodic analysis of Steve Jobs tone of voice. Comput. Hum. Behav. 64, 366–382. doi: 10.1016/j.chb.2016.06.059
Sridhar, V. K. R., Nenkova, A., Narayanan, S., and Jurafsky, D. (2008). "Detecting prominence in conversational speech: pitch accent, givenness and focus," in Proceedings of Speech Prosody (Campinas: Citeseer), 456.
Swerts, M., and Krahmer, E. (2008). Facial expression and prosodic prominence: effects of modality and facial area. J. Phonet. 36, 219–238. doi: 10.1016/j.wocn.2007.05.001
Swerts, M., and Krahmer, E. (2010). Visual prosody of newsreaders: effects of information structure, emotional content and intended audience on facial expressions. J. Phonet. 38, 197–206. doi: 10.1016/j.wocn.2009.10.002
Turco, G., Gubian, M., and Schertz, J. (2011). "A quantitative investigation of the prosody of Verum Focus in Italian," in Proceedings of Interspeech 2011 (Florence), 961–964. doi: 10.21437/Interspeech.2011-393
Vainio, M., and Järvikivi, J. (2006). Tonal features, intensity, and word order in the perception of prominence. J. Phonet. 34, 319–342. doi: 10.1016/j.wocn.2005.06.004
Wagner, P., Malisz, Z., and Kopp, S. (2014). Gesture and speech in interaction: an overview. Speech Commun. 57, 209–232. doi: 10.1016/j.specom.2013.09.008
Wichmann, A., House, J., and Rietveld, T. (1997). "Peak displacement and topic structure," in Intonation: Theory, Models and Applications (Athens), 329–332.
Yunus, F., Clavel, C., and Pelachaud, C. (2021). "Sequence-to-sequence predictive model: from prosody to communicative gestures," in Digital Human Modeling and Applications in Health, Safety, Ergonomics and Risk Management. Human Body, Motion and Behavior. HCII 2021. Lecture Notes in Computer Science, Vol 12777, ed V. G. Duffy (Cham: Springer), 355–374. doi: 10.1007/978-3-030-77817-0_25
Zellers, M., Gubian, M., and Post, B. (2010). "Redescribing intonational categories with Functional Data Analysis," in Proceedings of Interspeech 2010 (Makuhari), 1141–1144. doi: 10.21437/Interspeech.2010-361
https://www.frontiersin.org/articles/10.3389/fcomm.2022.903015/full