
A Visual Breakdown of Global Music Consumption
Published by Reblogs - Credits in Posts,
Visual Capitalist
Technology
A Visual Breakdown of Global Music Consumption

Published 1 day ago on February 6, 2023
Article/Editing:
A Visual Breakdown of Global Music Consumption
To maximize any chance of success in the music business, aspiring artists must gain an understanding of how music is consumed and how that is changing alongside technology.
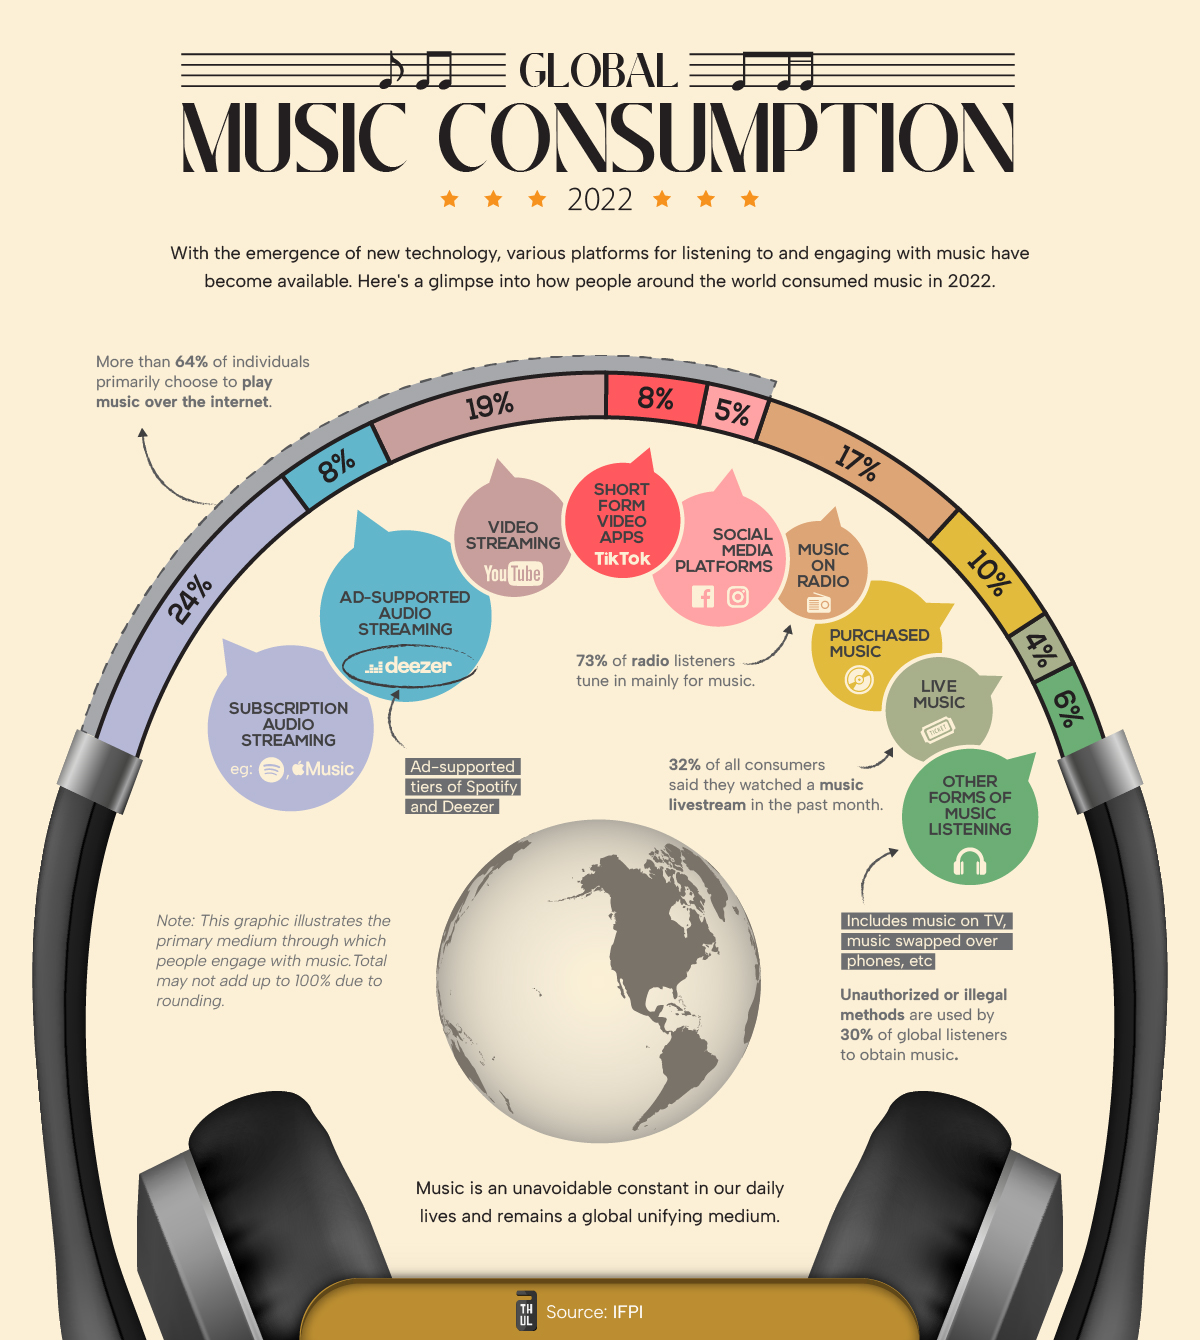
This graphic from Athul Alexander highlights global music consumption habits. Data is from 2022 and is sourced from a survey of over 44,000 people from 22 countries by IFPI that asked people their primary mode for consuming music.
As of 2022, paid subscription services (i.e. Apple Music, Spotify) are the most preferred option for listeners, accounting for nearly one-fourth of main platform share.
| Rank | Service | Share | Examples |
| 1 | Paid Audio Streaming | 24% | Spotify, Apple Music |
| 2 | Video Streaming | 19% | YouTube |
| 3 | Radio | 17% | |
| 4 | Purchased Music | 10% | Vinyls, CDs, purchased digital albums |
| 5 | Ad-Supported Audio Streaming | 8% | Amazon, Deezer |
| 6 | Short-form Videos | 8% | TikTok |
| 7 | Social Media Videos | 5% | Facebook, Instagram |
| 8 | Live Music | 4% | concerts, livestreams |
| 9 | Other | 6% | music on TV, phone-to-phone transfers |
Short-form video platforms like TikTok, with an 8% share of primary music listeners, are a fast-growing medium. Several young artists have found initial success and traction using these platforms over the past few years.
And though video "killed the radio star," it hasn’t killed listening to music on the radio. A healthy, 17% of respondents picked radio as their primary avenue for listening to music.
Streaming Supremacy and Virality
There’s no doubt that the internet has revolutionized how music is being consumed.
Including all video and music streaming, internet-based music consumption was the primary choice for 64% of respondents. That’s not even accounting for livestreams or music purchased through the internet.
| Platform | Share |
| Internet-based | 64% |
| Non-Internet Based | 37% |
This internet-heavy metric is being reflected on the business side as well, with 75% of the music industry’s revenues in the U.S. coming from streaming.
However, for artists, streaming revenue is usually the third-biggest earner after live performances and sales.
But utilizing streaming to its fullest potential keeps modern artists in the loop. For example, Beyoncé was one of the first artists to utilize streaming platforms to release an album completely unannounced in 2013, a marketing move that has been replicated many times since.
Where does this data come from?
Source: IFPI
Data note: IFPI surveyed over 44,000 people from 22 countries, asking them about their primary mode of consuming music. They exclude India and China from their global figures to prevent the size of the population from influencing the global weighted average. Percentages may also not add up to 100 because of rounded figures.
This article was published as a part of Visual Capitalist's Creator Program, which features data-driven visuals from some of our favorite Creators around the world.

Subscribe to our free newsletter and get your mind blown on a daily basis:
Related Topics:Musicconsumptionartistsmusic business


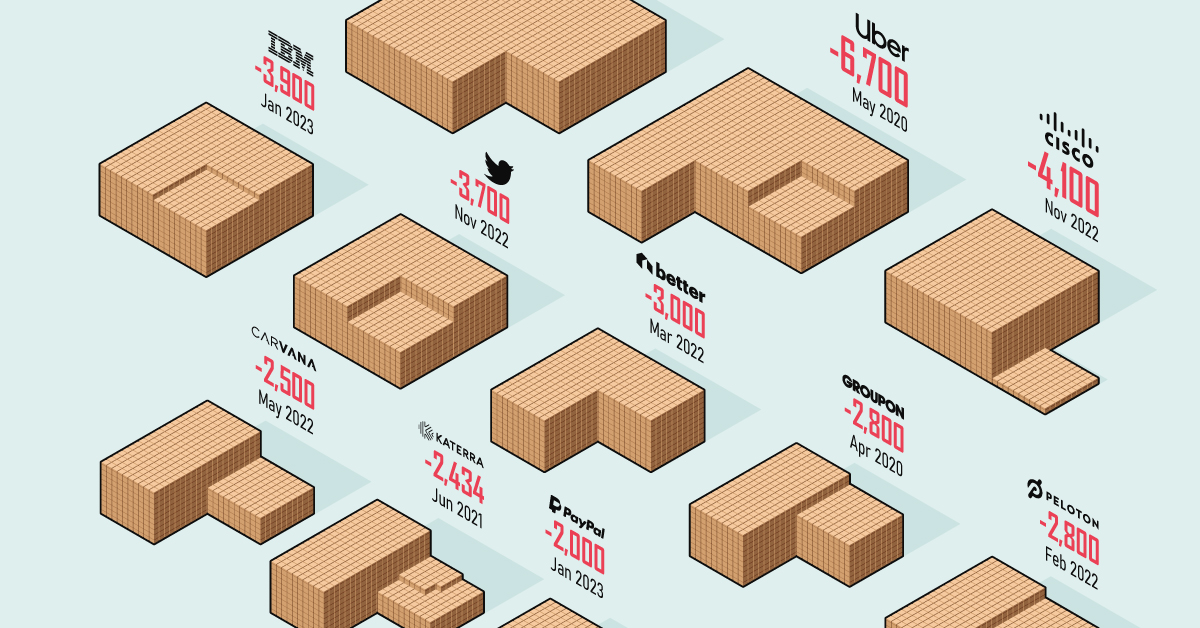
Ranked: America’s 20 Biggest Tech Layoffs This Decade
The events of the last few years could not have been predicted by anyone. From a global pandemic and remote work as the standard, to a subsequent hiring craze, rising inflation, and now, mass layoffs.
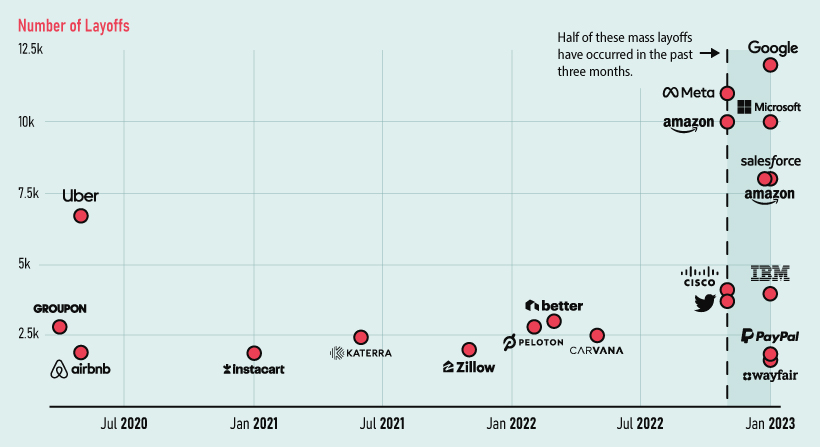
Alphabet, Google’s parent company, essentially laid off the equivalent of a small town just weeks ago, letting go of 12,000 people—the biggest layoffs the company has ever seen in its history. Additionally, Amazon and Microsoft have also laid off 10,000 workers each in the last few months, not to mention Meta’s 11,000.
This visual puts the current layoffs in the tech industry in context and ranks the 20 biggest tech layoffs of the 2020s using data from the tracker, Layoffs.fyi.
The Top 20 Layoffs of the 2020s
Since 2020, layoffs in the tech industry have been significant, accelerating in 2022 in particular. Here’s a look the companies that laid off the most people over the last three years.
| Rank | Company | # Laid Off | % of Workforce | As of |
| #1 | 12,000 | 6% | Jan 2023 | |
| #2 | Meta | 11,000 | 13% | Nov 2021 |
| #3 | Amazon | 10,000 | 3% | Nov 2021 |
| #4 | Microsoft | 10,000 | 5% | Jan 2023 |
| #5 | Salesforce | 8,000 | 10% | Jan 2023 |
| #6 | Amazon | 8,000 | 2% | Jan 2023 |
| #7 | Uber | 6,700 | 24% | May 2020 |
| #8 | Cisco | 4,100 | 5% | Nov 2021 |
| #9 | IBM | 3,900 | 2% | Jan 2023 |
| #10 | 3,700 | 50% | Nov 2021 | |
| #11 | Better.com | 3,000 | 33% | Mar 2022 |
| #12 | Groupon | 2,800 | 44% | Apr 2020 |
| #13 | Peloton | 2,800 | 20% | Feb 2022 |
| #14 | Carvana | 2,500 | 12% | May 2022 |
| #15 | Katerra | 2,434 | 100% | Jun 2021 |
| #16 | Zillow | 2,000 | 25% | Nov 2021 |
| #17 | PayPal | 2,000 | 7% | Jan 2023 |
| #18 | Airbnb | 1,900 | 25% | May 2020 |
| #19 | Instacart | 1,877 | -- | Jan 2021 |
| #20 | Wayfair | 1,750 | 10% | Jan 2023 |
Layoffs were high in 2020 thanks to the COVID-19 pandemic, halting the global economy and forcing staff reductions worldwide. After that, things were steady until the economic uncertainty of last year, which ultimately led to large-scale layoffs in tech—with many of the biggest cuts happening in the past three months.
The Cause of Layoffs
Most workforce slashings are being blamed on the impending recession. Companies are claiming they are forced to cut down the excess of the hiring boom that followed the pandemic.
Additionally, during this hiring craze competition was fierce, resulting in higher salaries for workers, which is now translating in an increased need to trim the fat thanks to the current economic conditions.
Of course, the factors leading up to these recent layoffs are more nuanced than simple over-hiring plus recession narrative. In truth, there appears to be a culture shift occurring at many of America’s tech companies. As Rani Molla and Shirin Ghaffary from Recode have astutely pointed out, tech giants really want you to know they’re behaving like scrappy startups again.
Twitter’s highly publicized headcount reduction in late 2022 occurred for reasons beyond just macroeconomic factors. Elon Musk’s goal of doing more with a smaller team seemed to resonate with other founders and executives in Silicon Valley, providing an opening for others in tech space to cut down on labor costs as well. In just one example, Mark Zuckerberg hailed 2023 as the "year of efficiency" for Meta.
Meanwhile, over at Google, 12,000 jobs were put on the chopping block as the company repositions itself to win the AI race. In the words of Google’s own CEO:
"Over the past two years we’ve seen periods of dramatic growth. To match and fuel that growth, we hired for a different economic reality than the one we face today… We have a substantial opportunity in front of us with AI across our products and are prepared to approach it boldly and responsibly."– Sundar Pichai
The Bigger Picture in the U.S. Job Market
Beyond the tech sector, job openings continue to rise. Recent data from the Bureau of Labor Statistics (BLS) revealed a total of 11 million job openings across the U.S., an increase of almost 7% month-over-month. This means that for every unemployed worker in America right now there are 1.9 job openings available.
Additionally, hiring increased significantly in January, with employers adding 517,000 jobs. While the BLS did report a decrease in openings in information-based industries, openings are increasing rapidly especially in the food services, retail trade, and construction industries.

Subscribe
Join the 365,000+ subscribers who receive our daily email


Copyright © 2022 Visual Capitalist
Tags: Music, Philosophy Of Art, Philosophy Of Music, Economics, Chart